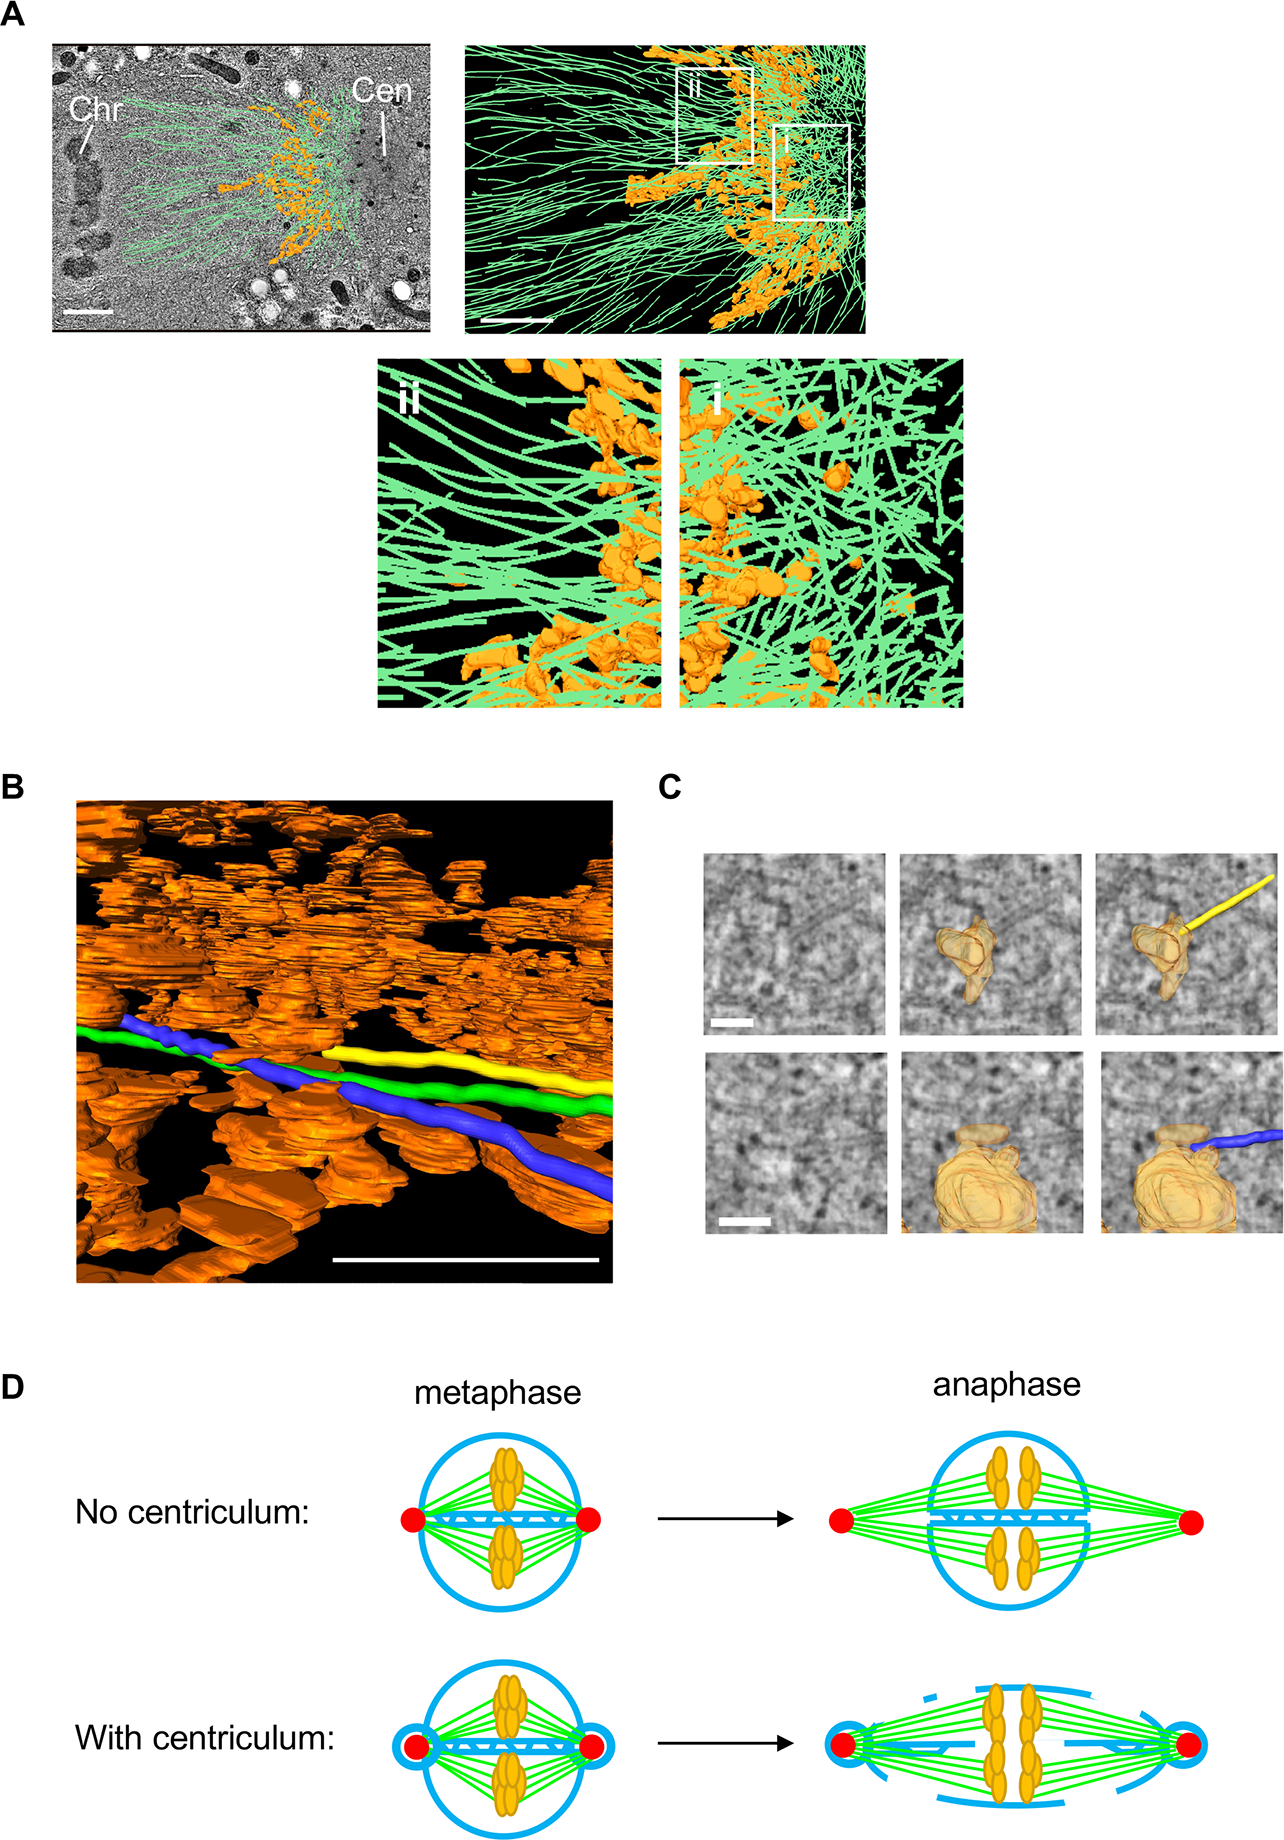
Figure 7: The centriculum may serve as a microtubule filter and assist in NE breakdown.

(A) Top left panel: microtubule vectors (green), and a segment of the centriculum (orange) between the centrosome (Cen) and nucleoplasm in a 1-cell embryo in metaphase, superimposed on a single TEM image. Tomography datasets, including microtubule assignments, are from 46. Metaphase chromosomes (Chr) can be seen on the far left of the image. Scale bar= 5 μm. Top right: the same microtubule and centriculum reconstructions as in the left panel, but without the TEM image, which obscures structures below the plane of the image. The thickness of this segment, along the z axis, is ~ 60 nm. Regions i and ii, on the centrosome and chromosome sides of the centriculum, respectively, are enlarged below. Scale bar= 5 μm. (B) Segmentation of three microtubules (marked in yellow, blue and green) shown as they traverse the centriculum (orange). Note that the yellow microtubule terminates at a membrane. See Video S1 for the entire route of these three microtubules through the centriculum. Scale bar = 0.5 μm. (C) TEM images (left column) overlayed with membrane reconstruction (middle column) and membrane + microtubules (right column) of the yellow and blue microtubules from panel B and Video S1 at the sites where they hit the membrane. Scale bar= 100 nm. See additional examples in Figure S7. (D) A diagram explaining the possible role of the centriculum in nuclear envelope fenestration during mitosis. Centrosomes are indicated in red, membrane in blue, microtubules in green and chromosomes in orange. See text for more detail. For related data see Figure S7.
