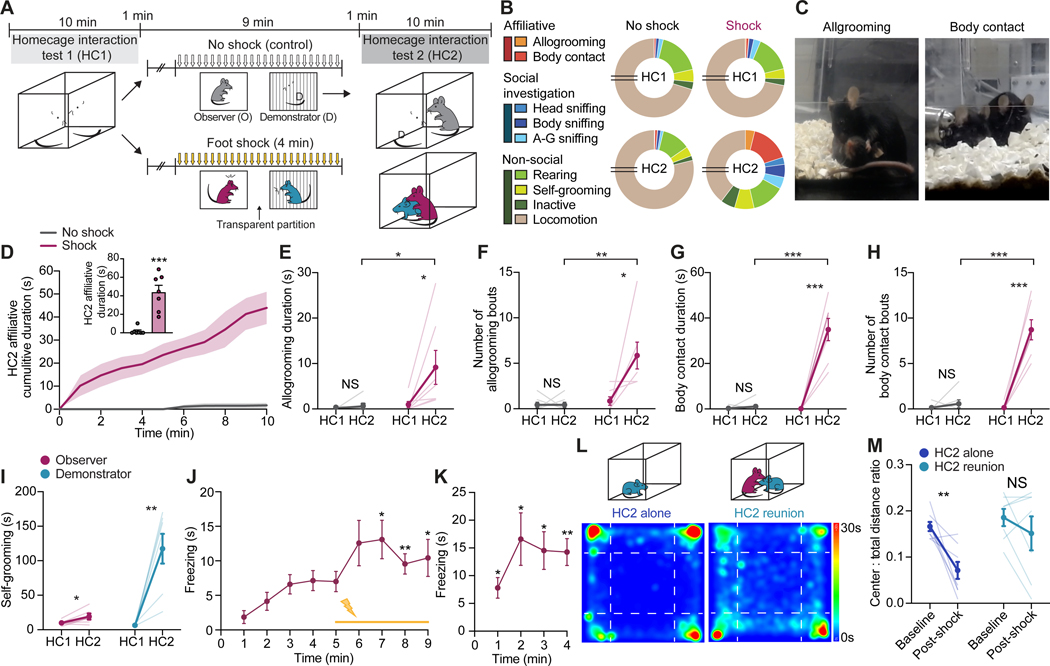
Figure 1. Other-directed consolation and emotional contagion in mice.
(A) Schematic of DIA paradigm. O, Observer; D, Demonstrator.
(B) Proportions of time observers spent engaging in different behaviors in HC1 and HC2. A-G, anogenital. Breaks in pie charts indicate 6 minutes of locomotion.
(C) Representative images of allogrooming and body contact behaviors initiated by observers toward demonstrators in HC2.
(D) Cumulative duration of other-dir8ected affiliative behaviors by observers during HC2. Inset, summary of mean affiliative duration.
(E-H) Allogrooming duration (E) and number of bouts (F) and body contact duration (G) and number of bouts (H) by observers in HC1 and HC2.
(I) Self-grooming duration during HC1 and HC2 by observer and shocked demonstrator mice.
(J and K) Total time freezing exhibited by observers during conditioning (J) and retrieval (24 hours later) (K) of OFC.
(L and M) Representative heat maps (L) depicting cumulative time at different locations by demonstrators during a 30-minute open field test and quantification of center-to-total distance ratio (M) by demonstrators before (baseline) and after DIA (post-shock). Demonstrators either remained alone (left) or were reunited with observers (right) after foot-shocks.
Statistics: (D-I, M), two-tailed paired or unpaired Student’s t-tests. (J and K), one-way repeated measures ANOVA with Dunnett’s post-hoc tests comparing freezing to the first minute of OFC baseline (no shock). *P < .05, **P < .01, ***P < .001. NS, not significant. See also Figure S1
and Video S1. In this and subsequent figures, data represents mean ± s.e.m. and statistical details are provided in Table S2.

