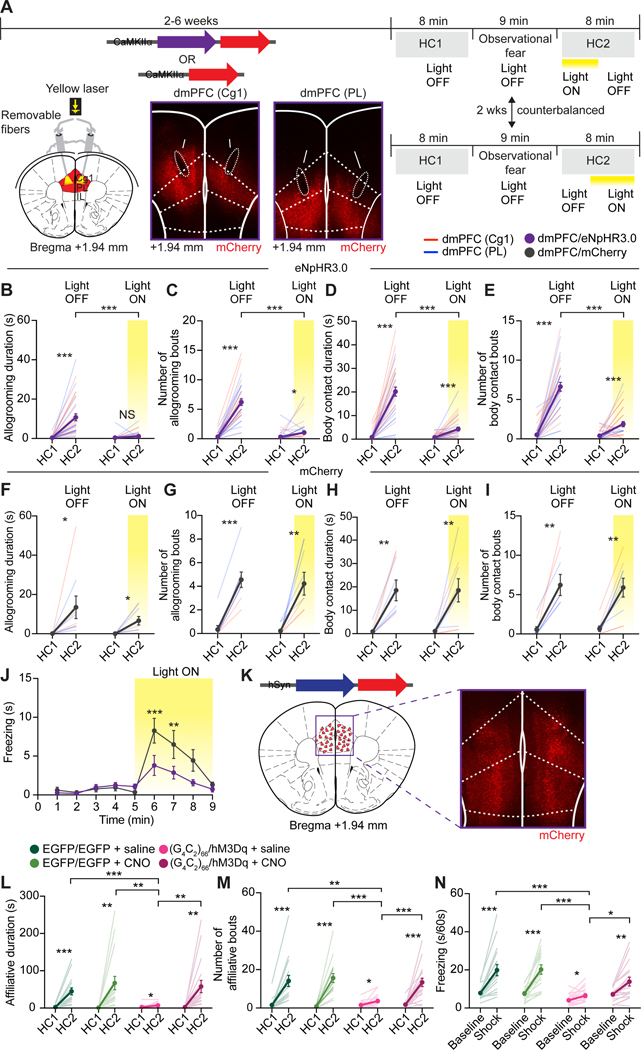
Figure 4. dmPFC-dependent mimic and rescue of FTD empathic deficits.
(A) Schematic, representative viral injection sites and expression and fiber placements at two dmPFC targets, and timeline of in vivo optogenetic experiments. Arrows, optic fiber tracts.
(B-I) Allogrooming duration (B and F) and number of bouts (C and G) and body contact duration (D and H) and number of bouts (E and I) during HC1 and HC2 by eNPHR3.0 (B-E) and mCherry observers (F-I) in observational DIA tests. Data from Cg1-targeted mice (dmPFC (Cg1); red lines) and PL-targeted mice (dmPFC (PL); blue lines) were combined to derive the means for dmPFC (dmPFC/eNpHR3.0 or dmPFC/mCherry).
(J) Freezing times by eNPHR3.0 and mCherry observers during OFC with photoinhibition.
(K) Representative AAV injection and expression in the dmPFC for in vivo chemogenetic experiments. Red triangles, injection sites.
(L-M) Affiliative duration (L) and number of bouts (M) by (G4C2)66/hM3Dq or EGFP observers transduced with AAV2-hSyn-EGFP (EGFP/EGFP) towards demonstrators in saline or CNO conditions.
(N) Average freezing time during baseline or shock phase of OFC by observers after saline or CNO injections.
Statistics: (B-I, L-N), two-tailed paired or unpaired Student’s t-tests. (J), two-way ANOVA with Bonferonni’s post-hoc tests. *P < .05, **P < .01 ***P < .001. See also Figures S3 and S4 and Video S2.

