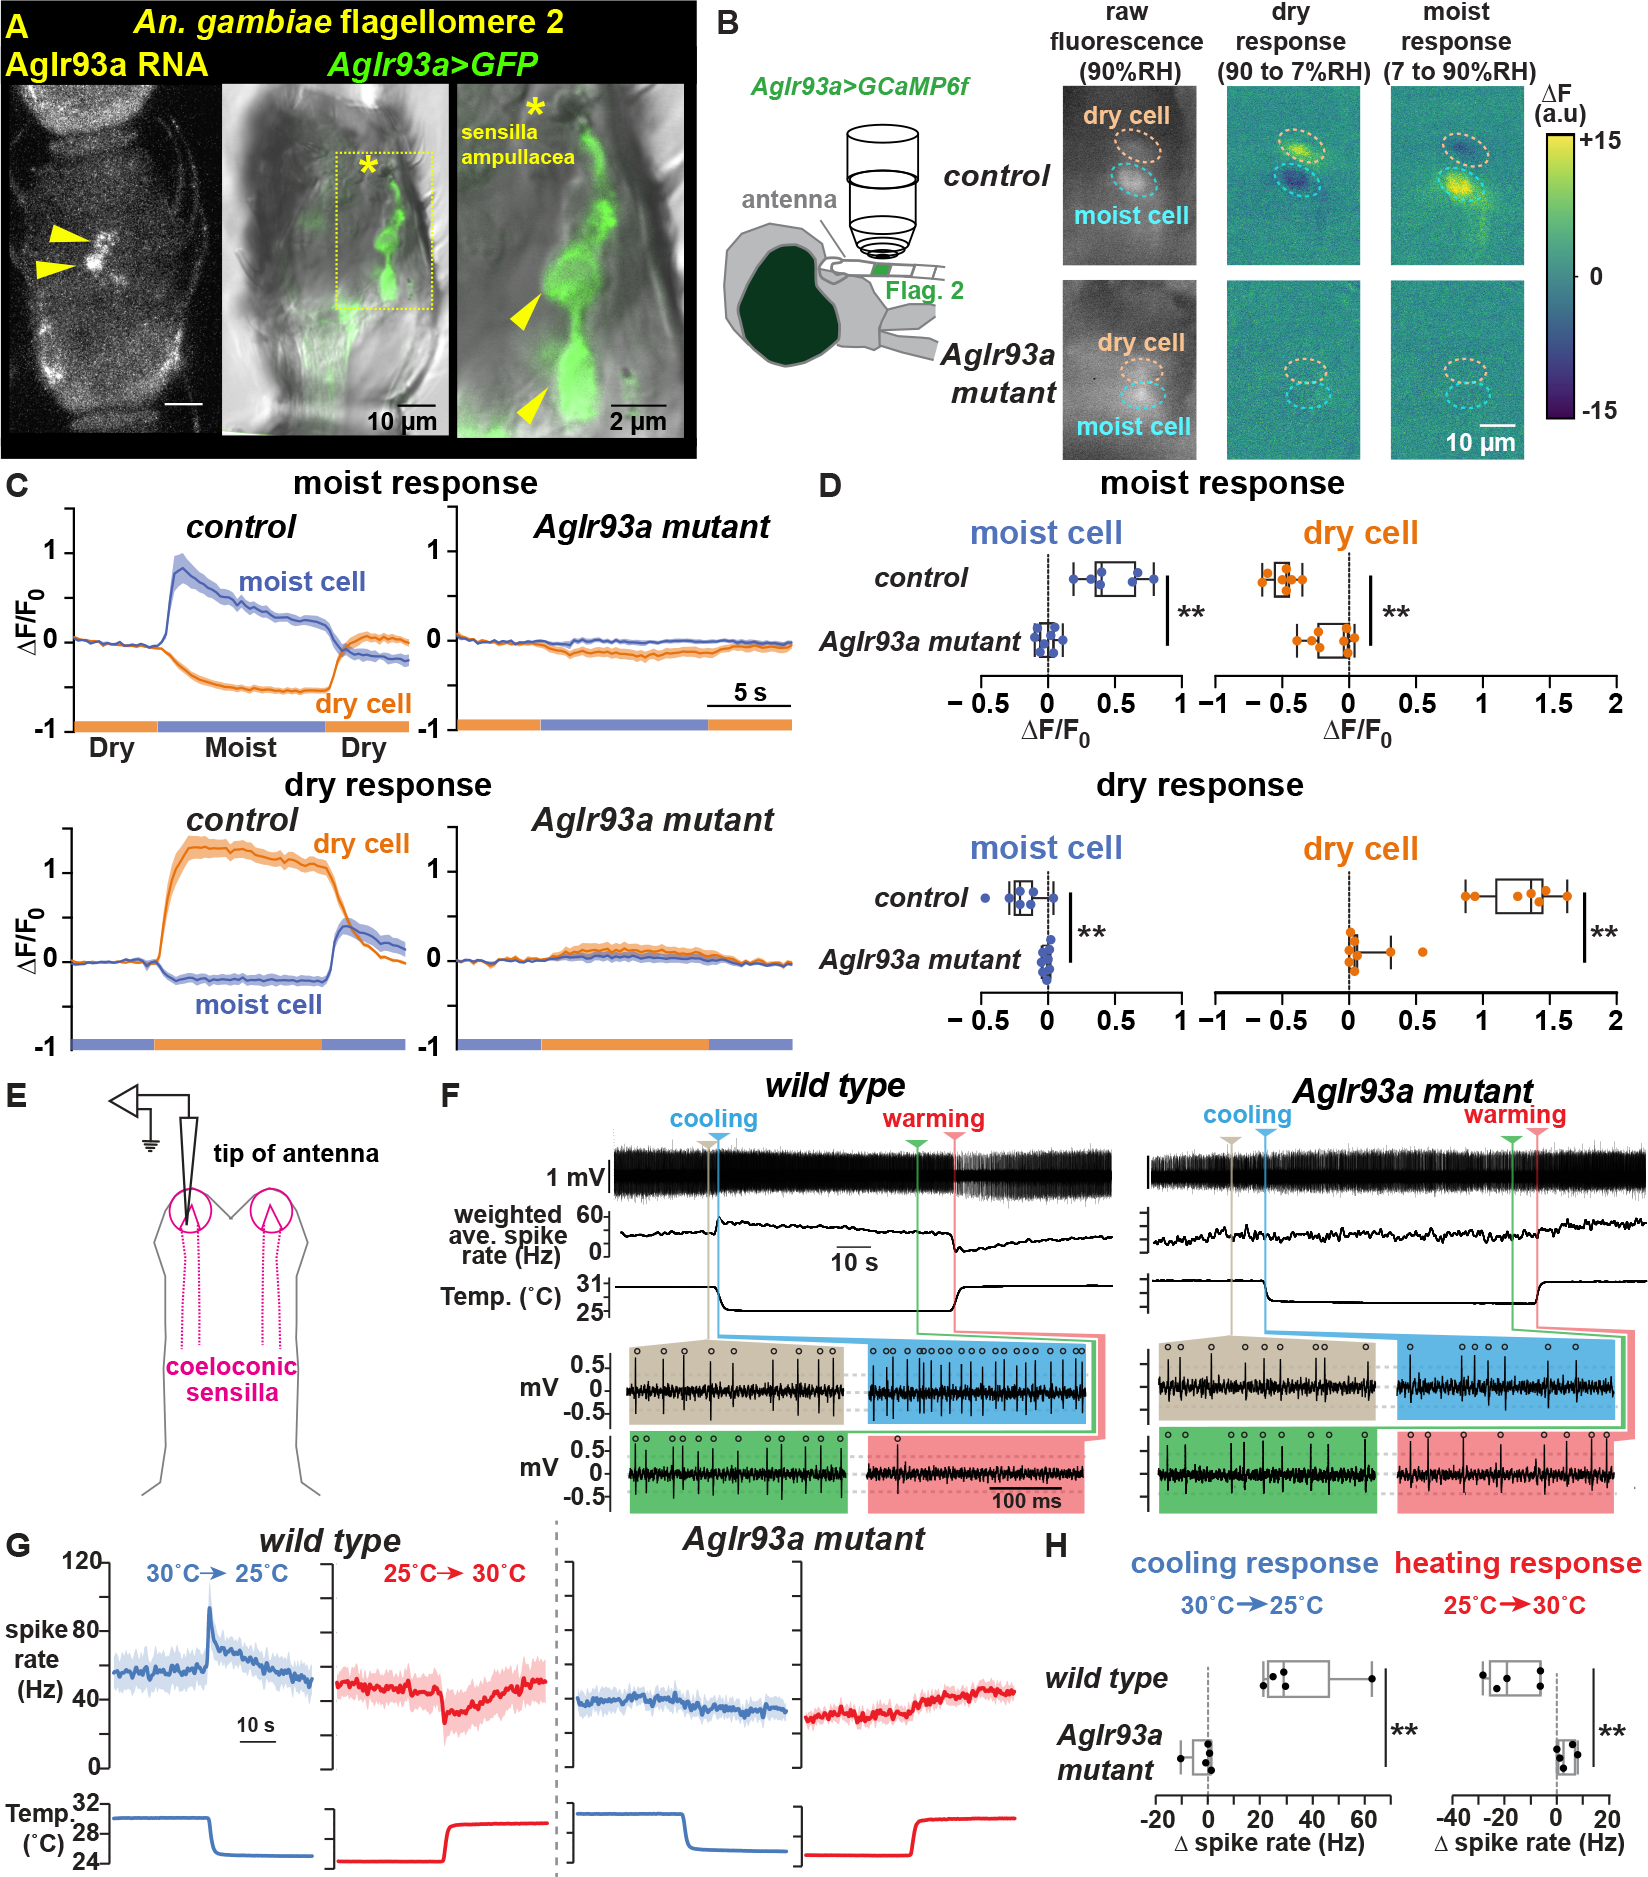
Figure 4: AgIr93a mediates hygrosensation and thermosensation.

(A) AgIr93a in situ and AgIr93apore-RFP>CD8:GFP-labeled neurons in flagellomere 2. Arrowheads, cell bodies. Asterisk, sensilla ampullacea opening. (B) Trans-cuticular imaging of AgIr93apore-RFP>GCaMP6f fluorescence and its change upon relative humidity (RH) shifts. Dashed ovals, soma. (C) Responses to RH shifts between 90% (moist) and 7% (dry). Mean +/− SEM. Control (AgIr93apore-RFP/+), n=7 animals. AgIr93a mutant (AgIr93apore-RFP/AgIr93apore-EYFP), n=8. F0 = average 5.5s to 1s pre-stimulus-switch. (D) Fluorescence change upon switching between moist and dry. ΔF = F(average 3s to 5.5s post-switch) − F0. ** p<0.001, t-test. (E) Coeloconic sensilla recording. (F) wild type (G3) and AgIr93a mutant (AgIr93aTM2-RFP/AgIr93aTM2-EYFP) recordings. Weighted average spike rates (1s triangular window). Colored panels highlight activity at indicated times. Open circles, spikes. Dashed lines, thresholds. (G) Peri-stimulus time histograms (average +/− SEM). Cooling, blue. Warming, red. wild type, n=5 animals. AgIr93aTM2-RFP/AgIr93aTM2-EYFP, n=5. (H) Cooling response = (average Hz 0.2s-0.7s after cooling onset) – (average Hz 5s-10s pre-cooling). ** p=0.009, Wilcoxon. Heating response = (average Hz 0.5s-1.5s after heating onset) – (average Hz 5s-10s pre-heating). ** p= 0.0026, t-test.
