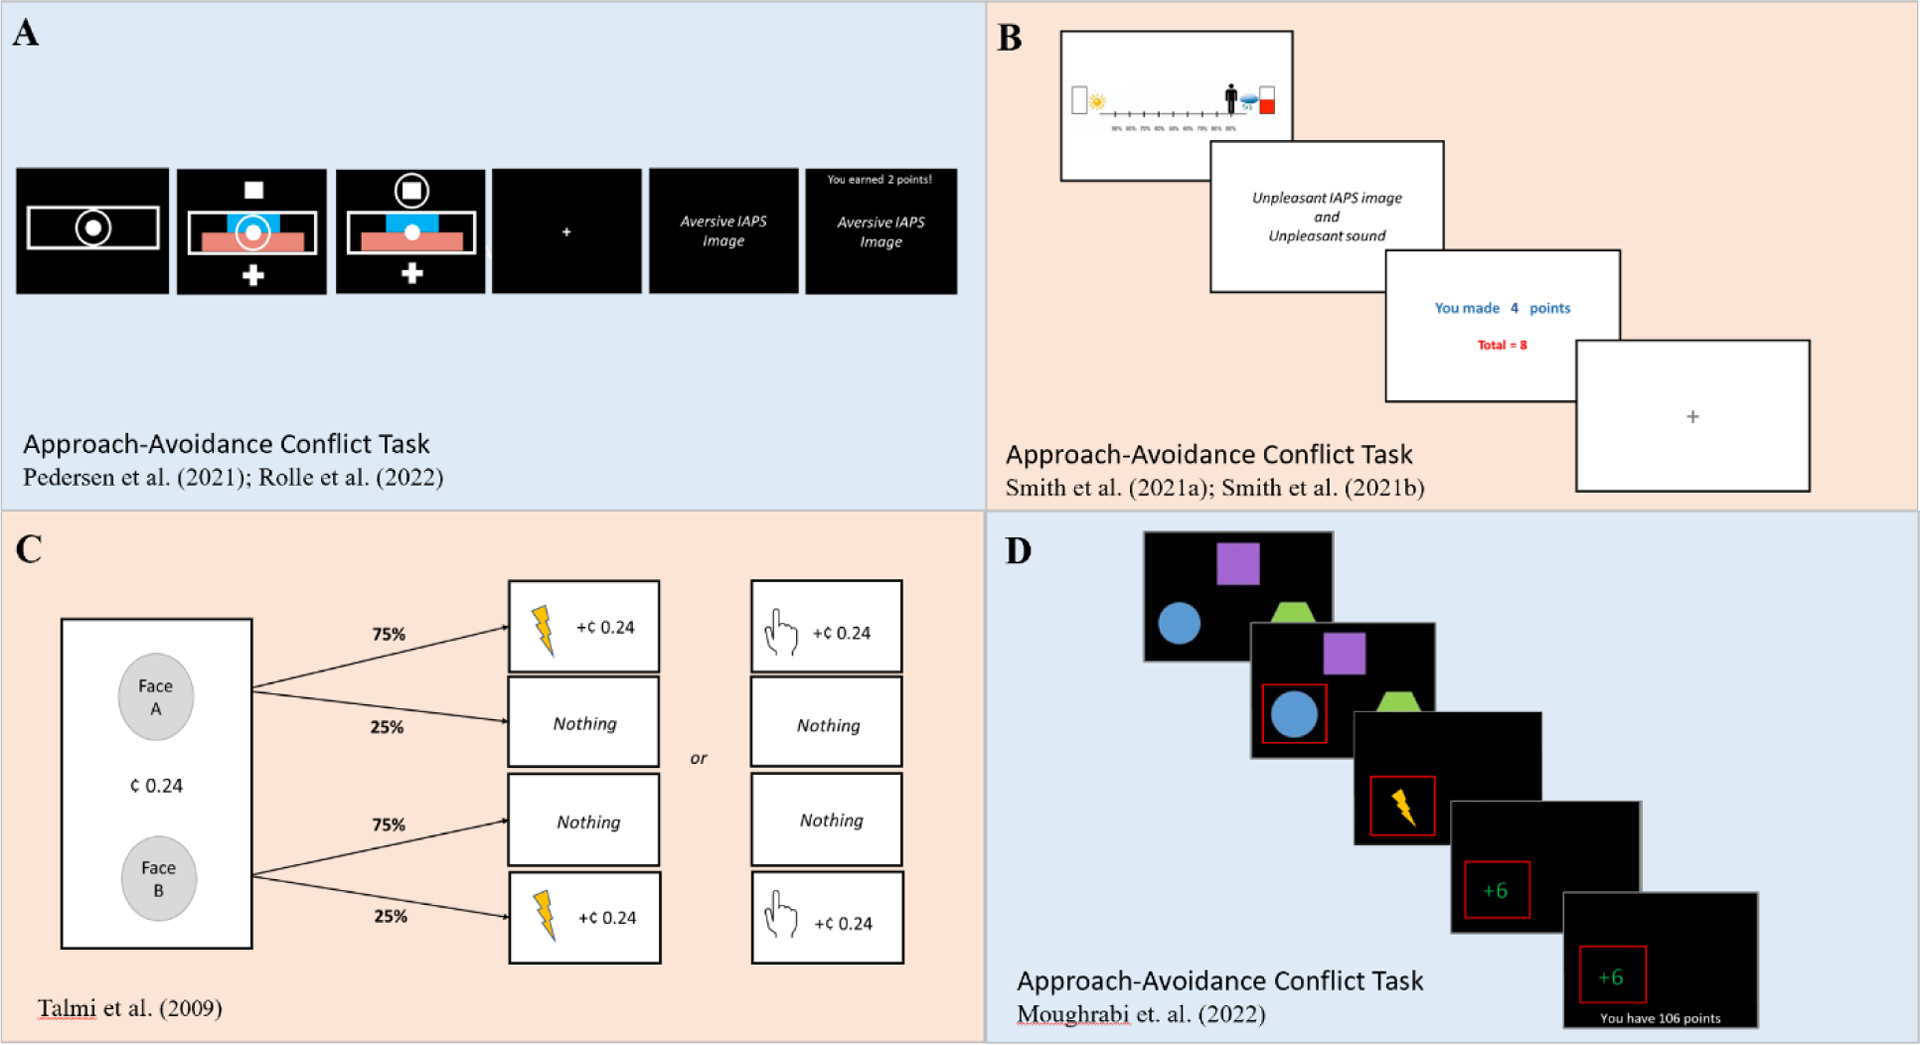
Figure 1.

Graphical depiction of tasks that have been used to assess approach-avoidance conflict, which were reproduced from the original manuscripts. The tasks included below included a computational approach to model participants’ behavior: (A) Participants choose to approach or avoid an offer of a potential reward and punishment by moving a circle located at the center either upward or downward. Punishment intensity is scaled from 1 to 5, using the normative negative valence rating for a picture from the International Affective Picture Series. Reward intensity was also scaled from 1 to 5, given by points. (B) Participants move an avatar along a runway closer or further away from an anchor. The closer a participant moves toward one of the anchors, the more likely that the outcome closest to that anchor will occur (and the less likely that the other outcome will occur). (C) Participants choose between two faces, which probabilistically led to either a painful or mild stimulation or nothing. If stimulation occurs, participants also gain (or lose) a previously displayed amount of money. Approach resulted in points and punishment, whereas avoidance resulted in neither. (D) Participants choose one of three geometric shapes, each of which has a different (independent) likelihood of delivering an electrotactile stimulation (shock) and points. The task includes a baseline period, followed by alternating blocks of high and low conflict. During high conflict, the shape that is most likely to deliver a shock is also most likely to deliver points. During low conflict, the shape that is most likely to deliver a shock is also least likely to deliver points.
