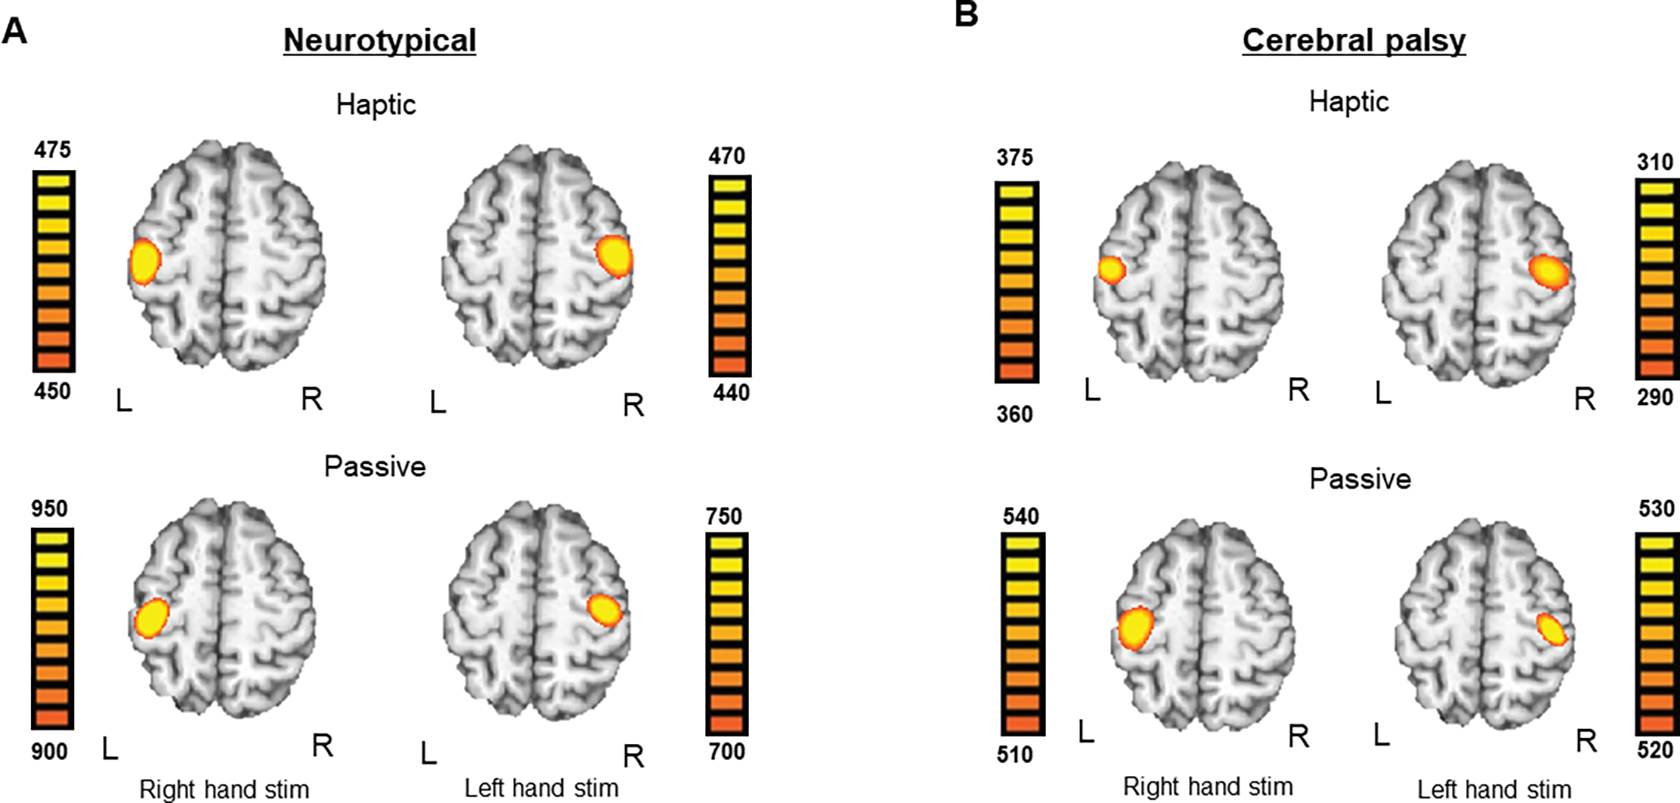
Figure 2:

Brain images averaged within group for neurotypical (NT) controls and persons with cerebral palsy (CP), separated by condition and side of stimulation. In each panel, neural data for stimulation of the right hand is shown on the left and stimulation of the left hand is shown on the right. A.) Brain images averaged across NT controls on the left and right side during the haptic condition (top) and passive condition (bottom) B.) Brain images averaged across persons with CP on the left and right side during the haptic condition (top) and passive condition (bottom). Note that the image scale bars are different across the respective images. This was done to enable the anatomical location of the peak response to be accurately visualized in each map. Hence, the magnitude of the scale bars should be used when interpreting if the neural responses were weaker or stronger per condition, side, and group. See text for further explanation.
