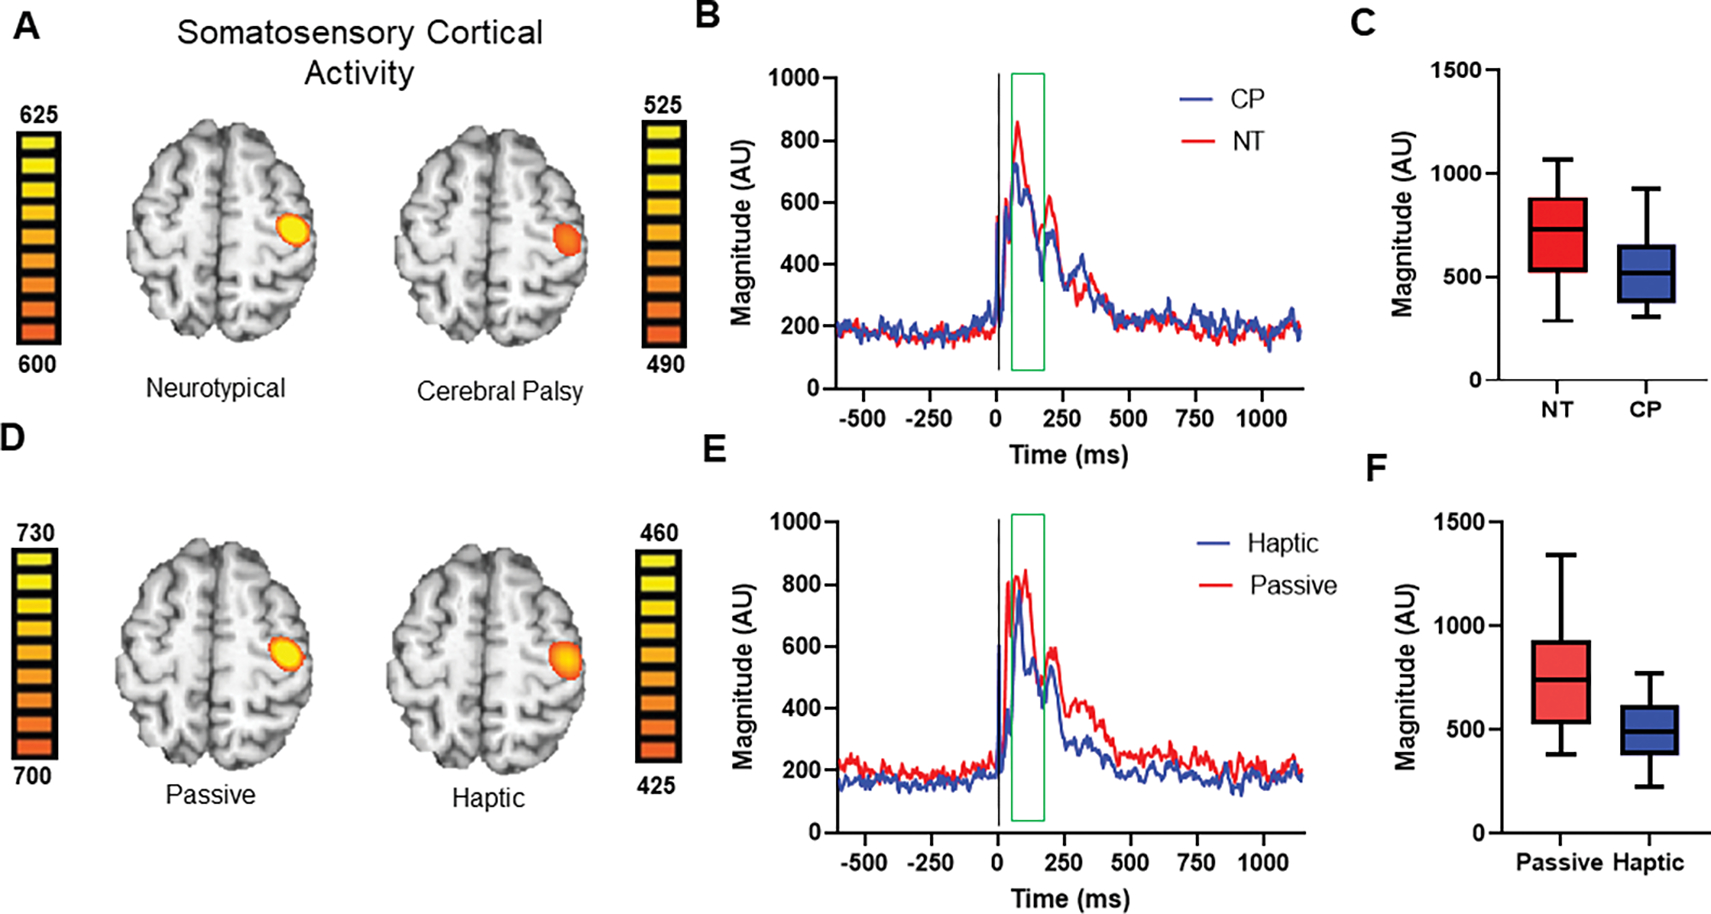
Figure 3.

A.) Somatosensory cortical activity in the neurotypical (NT) controls and the youth with cerebral palsy (CP) averaged across the two conditions. For illustration purposes, persons with stimulation on the left side are shown. Note that the image scale bars are different across the respective images. This was done to highlight the precise anatomical location of the neural responses. Hence, the magnitude of the scale bars should be used when interpreting if the source activity was weaker or stronger across groups. B.) Neural time course representing the somatosensory cortical activity averaged across all NT controls (red) and youth with CP (dark blue). The green box denotes the time window analyzed (28 – 168 ms), with the stimulation onset being at time zero, represented by a vertical black line. Note that time series were extracted from individual peaks. C.) Box and whisker plot representing the difference in somatosensory cortical activity between the youth with CP and NT controls. The box represents the median, 25th and 75th percentiles, and the whiskers represent the 5th and 95th percentile. As depicted, the youth with CP had a much weaker response (P = 0.014). D.) The somatosensory cortical activity from the haptic and passive conditions averaged across all participants. For illustration purposes, persons with stimulation on the left side are shown. Note that the image scale bars are different across the respective images. This was done to highlight the precise anatomical location of the neural responses. Hence, the magnitude of the scale bars should be used when interpreting if the source activity was weaker or stronger across conditions. E.) Neural time course representing the somatosensory cortical activity averaged by condition across all participants, with the haptic data shown in dark blue and the passive data shown in red. The green box denotes the time window analyzed, and the stimulation onset is at time zero, represented by a vertical black line. F.) Box and whisker plot representing the difference in somatosensory cortical activity between the haptic and passive conditions. The box represents the median, 25th and 75th percentiles, and the whiskers represent the 5th and 95th percentile. As depicted, the somatosensory cortical activity evoked during the passive condition was much stronger than the cortical activity evoked during haptic condition (P < 0.001).
