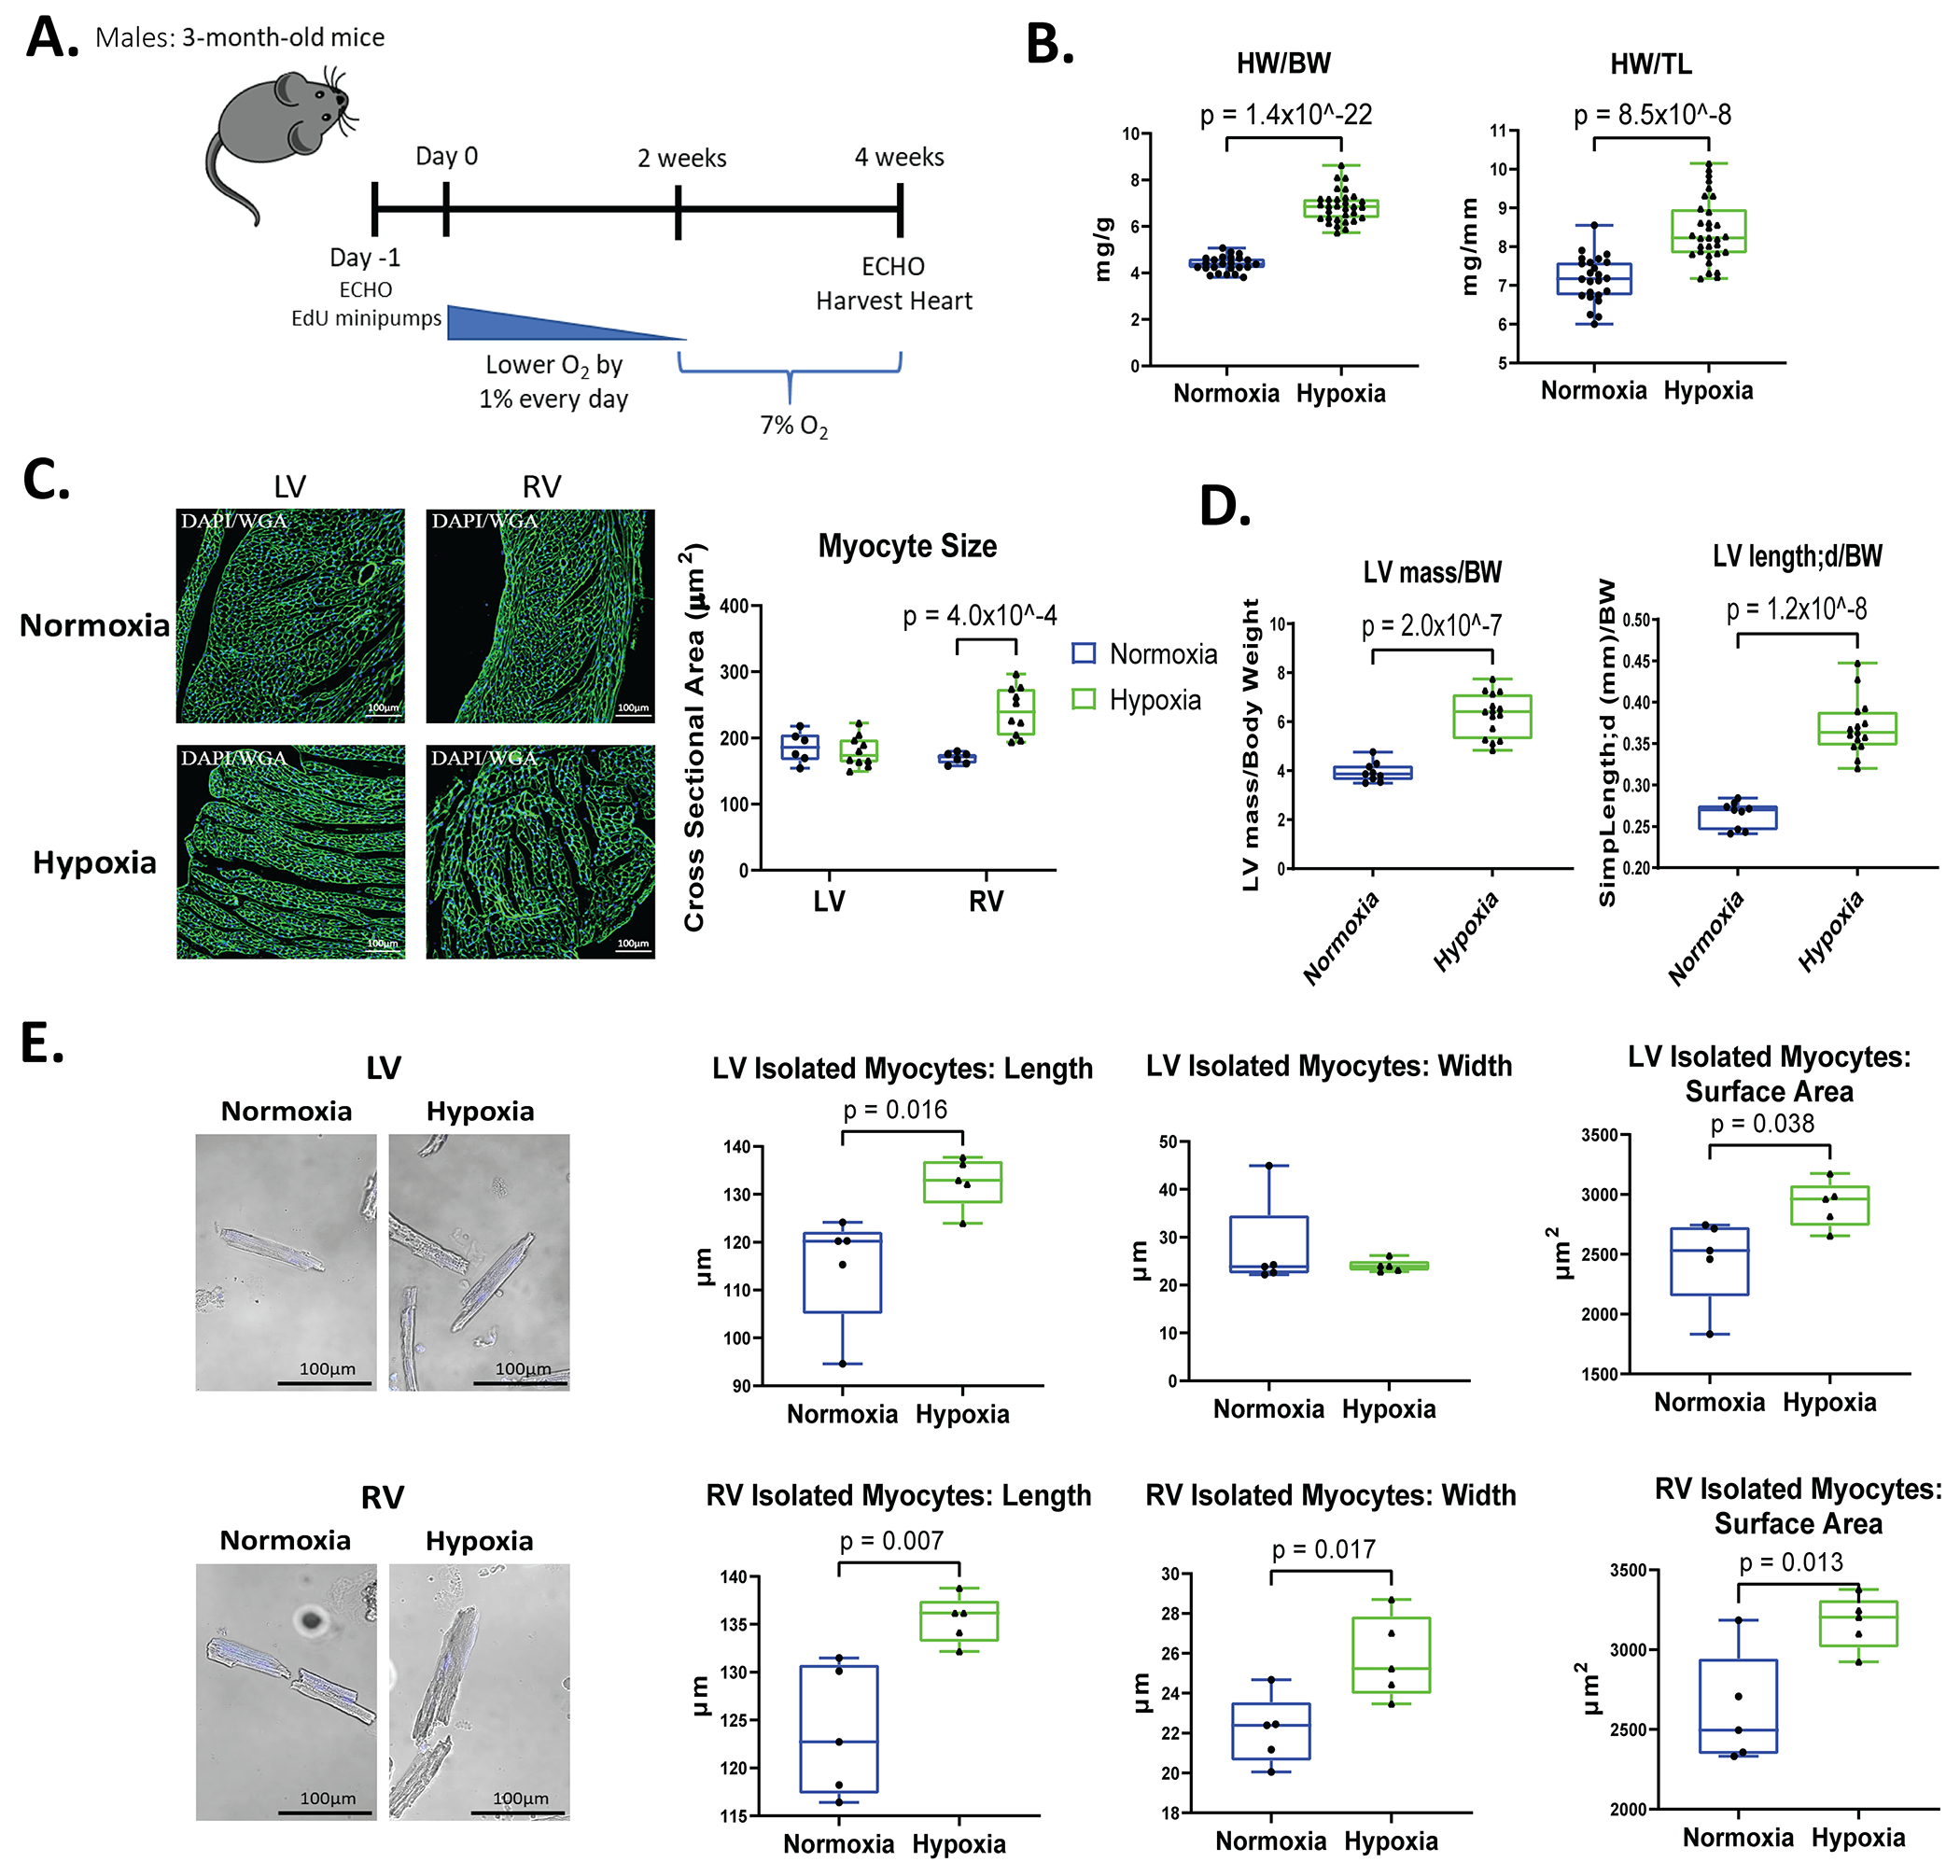
Figure 1. Chronic hypoxia induces different forms of LV and RV hypertrophy in male mice.

A: Schematic of hypoxia protocol in male mice with gradual reduction in oxygen levels to reach 7% for 2 weeks. B: Heart weight to body weight (HW/BW) and heart weight to tibia length (HW/TL) were measured at the time of harvest (Normoxia n=24, Hypoxia n=31). C: Myocyte size was determined from wheat germ agglutinin (WGA) staining of hearts and measurement of cross-sectional area of left ventricular (LV) and right ventricular (RV) myocytes with visible nuclei (normoxia n=6, hypoxia n=10). D: Echocardiography was performed during terminal studies. LV mass and the length of the LV measured by parasternal long axis (PSLAX) view relative to body weight was determined. E: Cardiac myocytes were isolated from the LV and RV of the heart and stained with DAPI to label nuclei. Myocyte length, width, and surface area (SA) were measured in at least 100 ventricular cardiomyocytes of the LV and RV from each mouse (n=5). Data represented as mean±SD.
