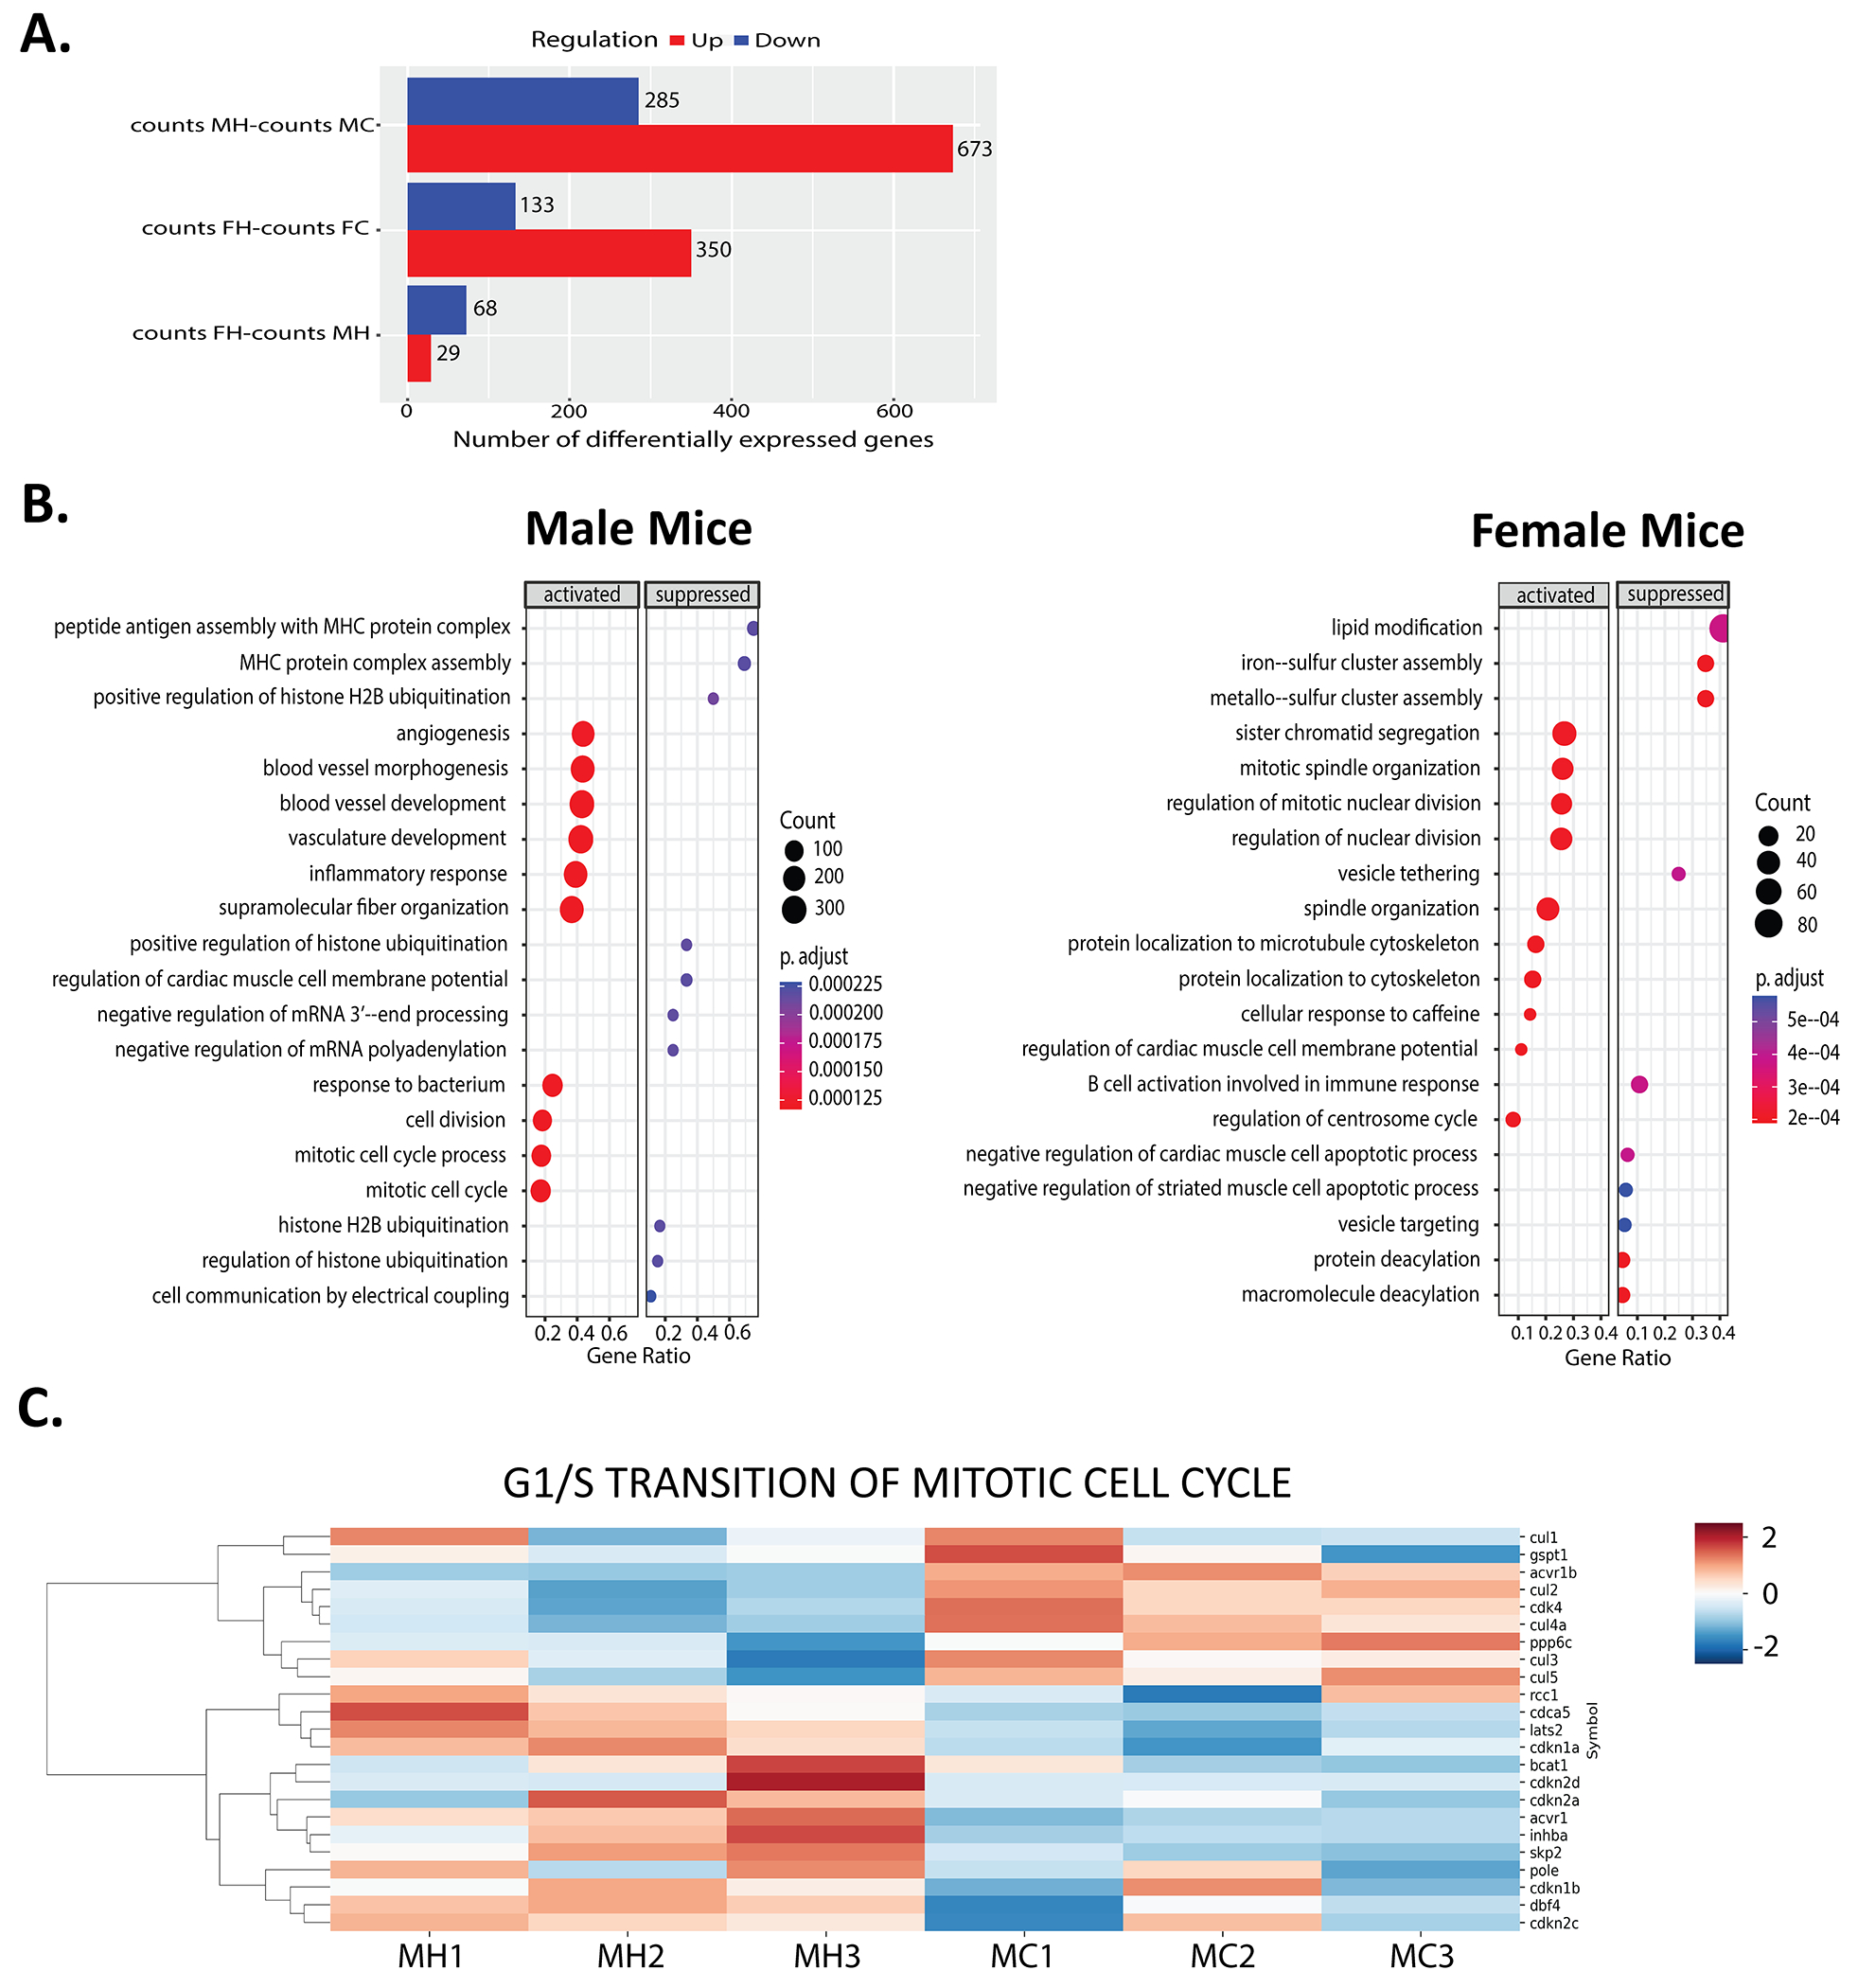
Figure 6. Hypoxia induces upregulation of mitotic cell cycle genes with similar gene expression profile in both sexes.

RNA sequencing analysis on male (M) and female (F) hearts in normoxia control (C) or hypoxia (H) group. A: Number of differentially expressed genes in MH vs. MC, FH vs. FC, and FH vs MH mice as presented in bar graphs. B: GO analysis depicted dot plots of male and female mice with most significantly activated or suppressed biological processes including mitosis, angiogenesis, apoptosis, and immune cell response. C: Heat maps of relative expression level of genes involved in G1 to S phase transition (GO:0000082) in MH vs. MC mice. Upregulated and downregulated genes shown as red and blue, respectively (n=3 each group).
