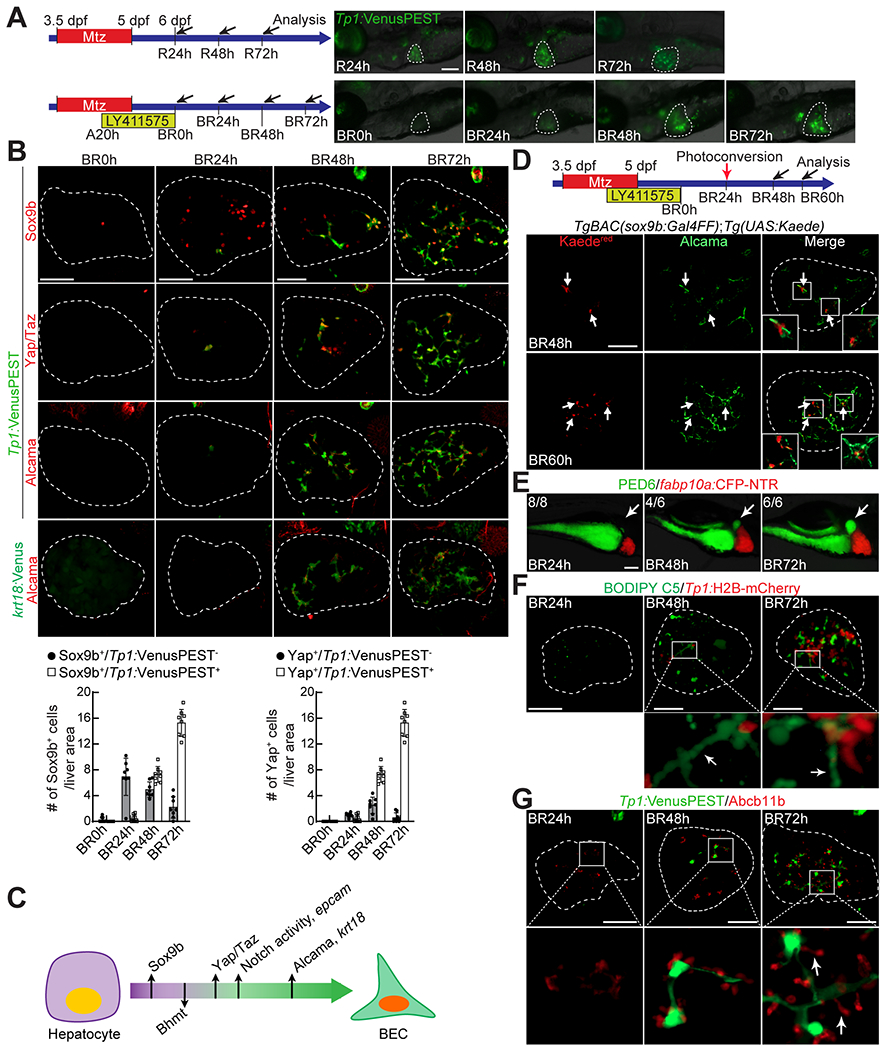
Figure 1. A zebrafish model for hepatocyte-to-BEC conversion.

(A) Epifluorescence images showing Tp1:VenusPEST expression in regenerating larvae. Scheme illustrates the periods of Mtz and LY411575 treatments and the stages of liver and biliary regeneration (R and BR, respectively) and analysis (arrows). (B) Confocal projection images showing the expression of Sox9b, Yap/Taz, Alcama, Tp1:VenusPEST, and krt18:Venus in regenerating livers (dashed lines). The number of Sox9b+ or Yap/Taz+ cells with or without Tp1:VenusPEST expression is quantified and presented as mean ± SD. (C) Scheme illustrating the order of the induction of BEC markers and the disappearance of the hepatocyte marker during hepatocyte-to-BEC conversion. (D) Confocal projection images showing the expression of Alcama and Kaedered in regenerating livers. The TgBAC(sox9b:Gal4FF) and Tg(UAS:Kaede) lines were used to trace sox9b+ cells (arrows) by exposing the transgenic larvae to UV at BR24h. (E) Epifluorescence images showing PED6 accumulation in the gallbladder (arrows) and fabp10a:CFP-NTR expression in regenerating livers. Numbers in the upper left corner indicate the proportion of larvae exhibiting the same level of the gallbladder accumulation shown. (F) Confocal projection images showing BODIPY C5 staining and Tp1:H2B-mCherry expression in regenerating livers. Boxed regions are enlarged below; arrows point to well elongated bile ductules. (G) Confocal projection images showing Abcb11b and Tp1:VenusPEST expression in regenerating livers. Boxed regions are enlarged below; arrows point to well extended bile canaliculi. Dashed lines circle the livers. Scale bars: 50 (B,D,F,G), 100 (A,E) μm.
