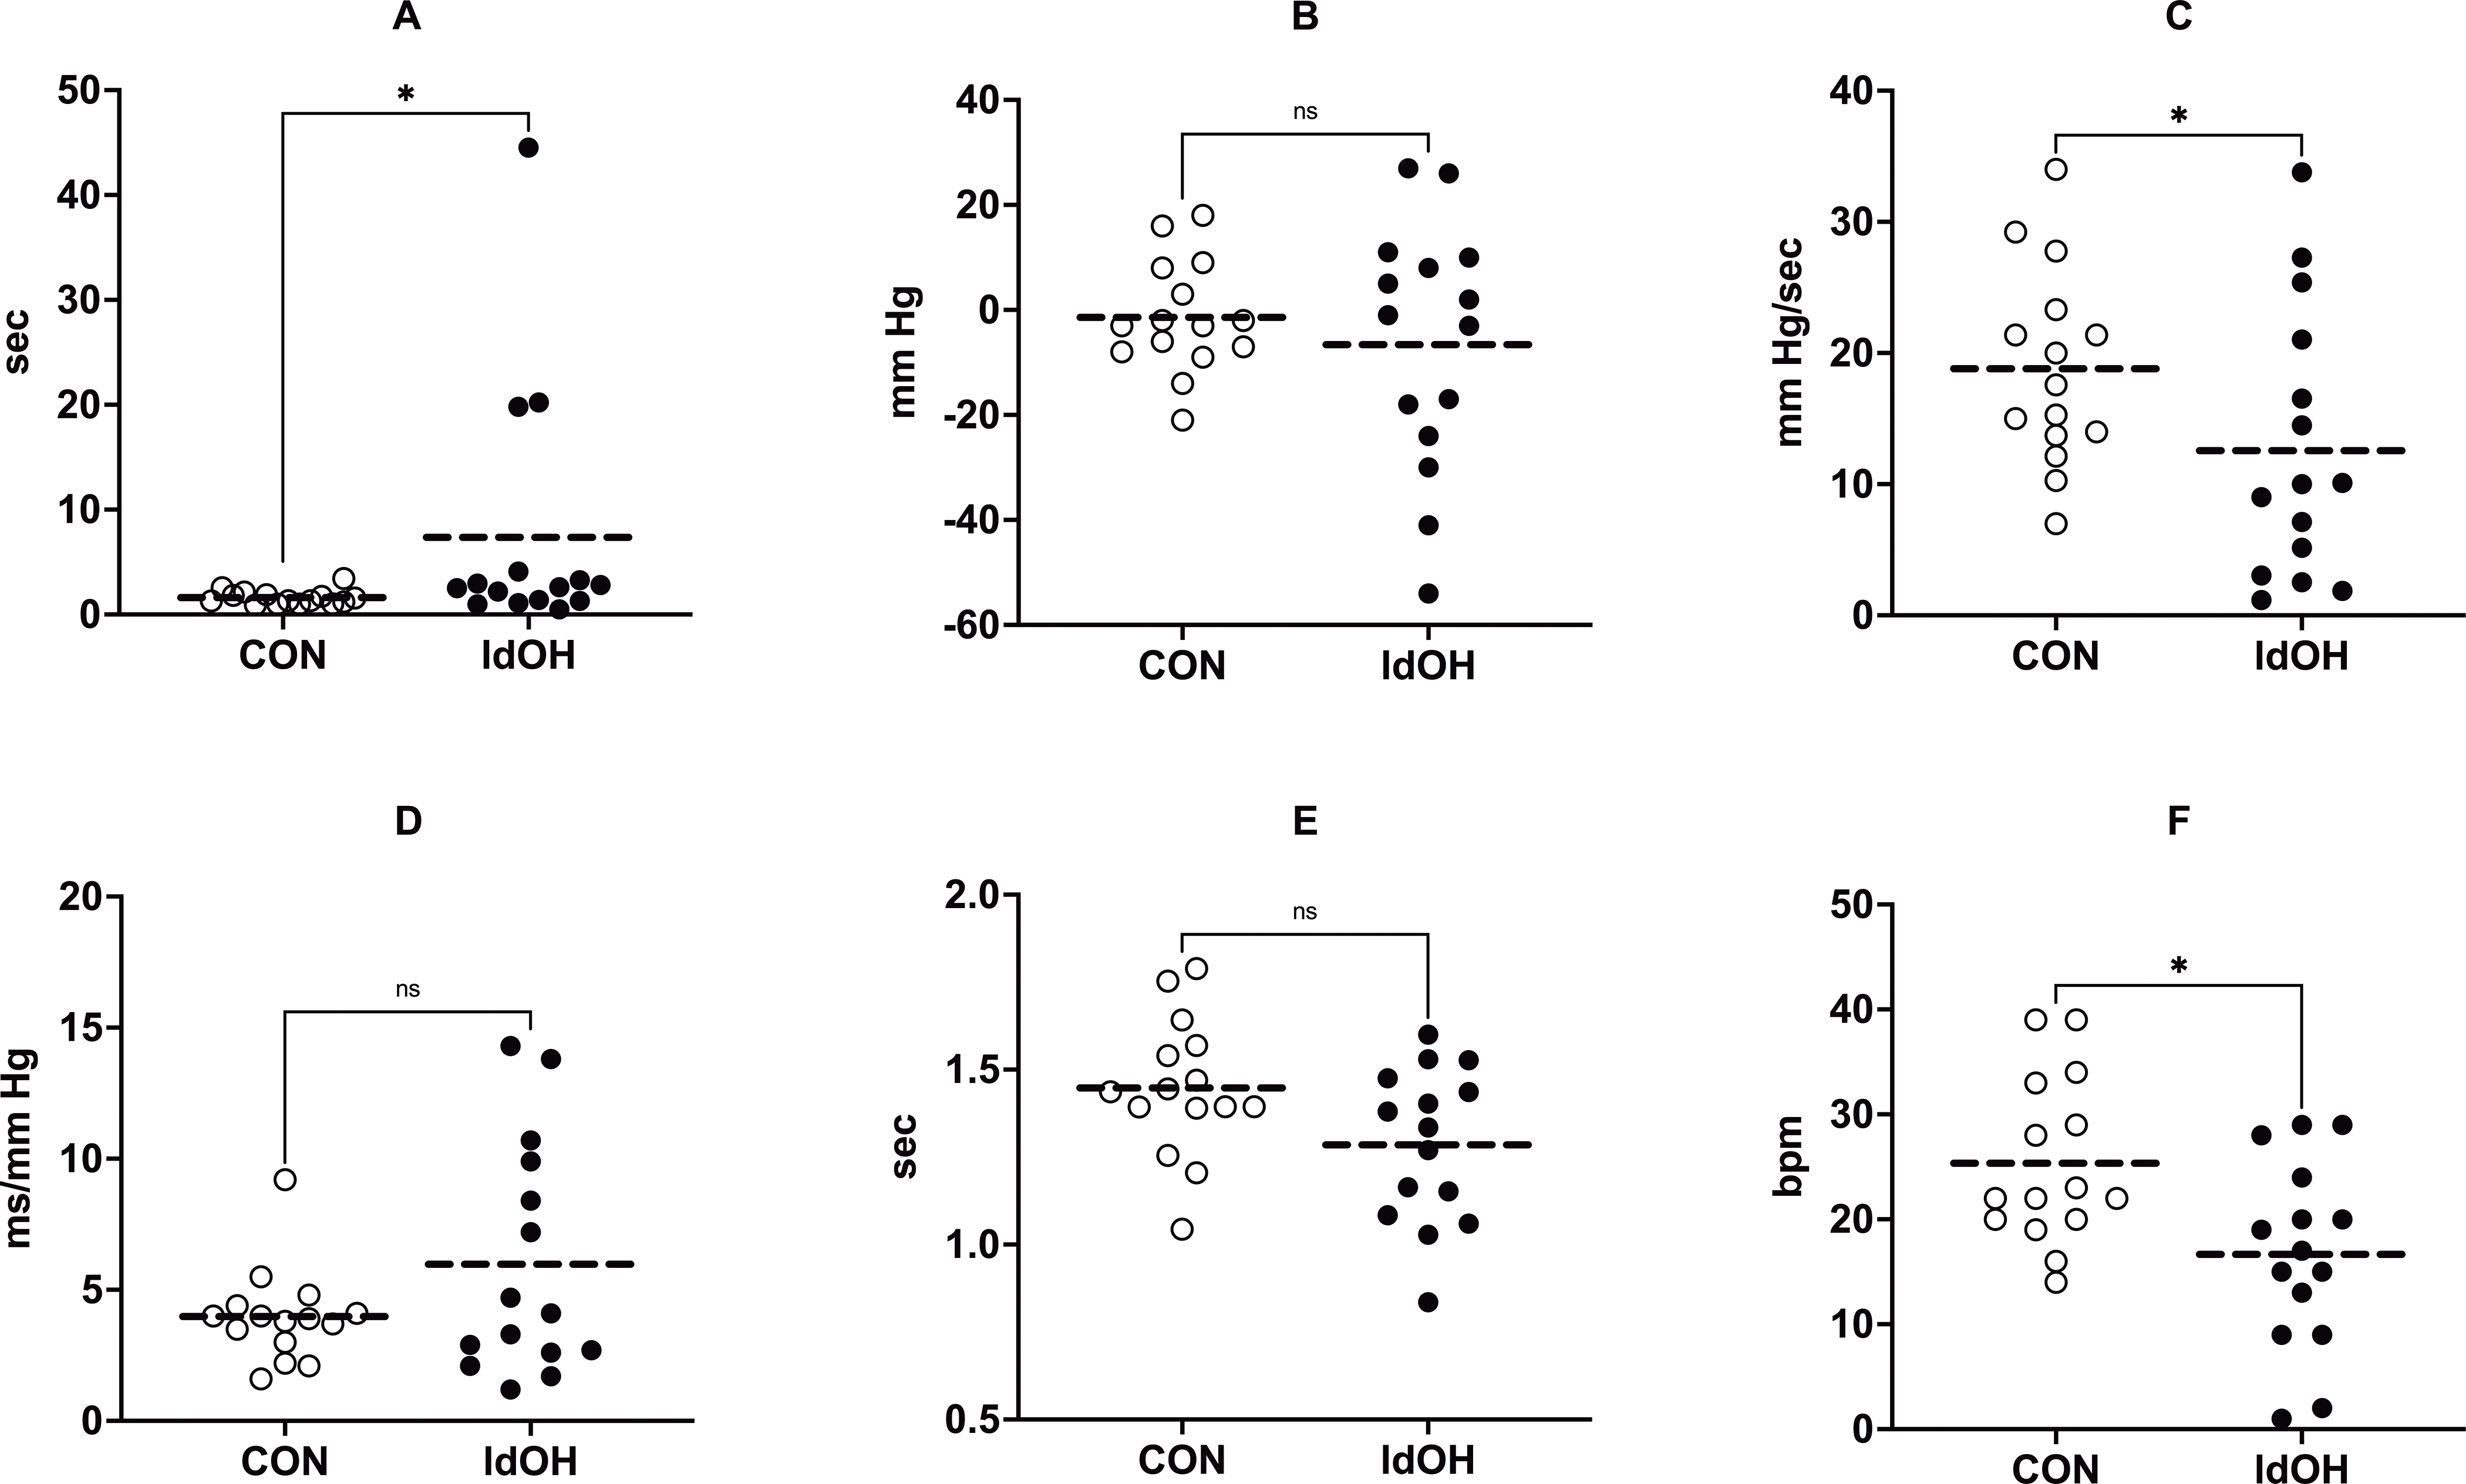
Figure 3. The age- and sex-matched comparison of the Valsalva metrics in normal controls (CON) and the late-onset dOH (ldOH) group.

(A) PRT, (B) ΔSBPVM2, (C) BRSa, (D) BRSv, (E) Valsalva Ratio, (F) ΔHRVM3. ****, P ≤ 0.0001; ***, P ≤ 0.001; ns, P > 0.05. Statistical analyses were performed using the Mann–Whitney U test.
