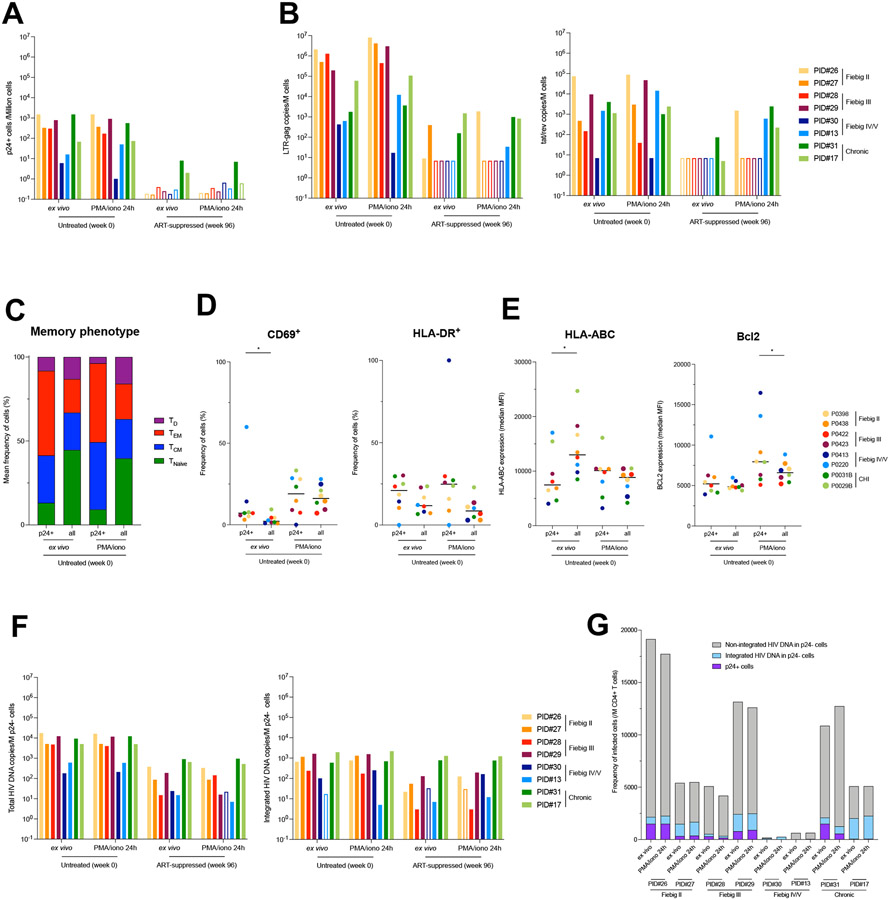
Fig. 6. Limited inducibility of HIV genomes archived during acute infection and persisting on ART.
A. Frequency of p24+ cells measured by HIV-Flow in longitudinal blood samples of participants enrolled at different Fiebig stages (week 0) and after 96 weeks of ART. Frequencies were measured ex vivo to detect productively infected cells and after stimulation with PMA/ionomycin for 24h to detect the inducible reservoir. B. Total RNA from unstimulated or stimulated CD4+ T cells was used to quantify unspliced (LTR-gag) and multiply spliced RNA (tat/rev). HIV transcripts were normalized to the number of input cells. C. Proportion of each memory subset in p24+ cells and total CD4+ T cells at the viremic and on ART time points, both ex vivo or after stimulation with PMA/ionomycin (n = 16 samples). Infected cells were overrepresented in the TEM subset. D. Activation status of infected cells. The frequency of each subset (CD69+, HLA-DR+) is depicted ex vivo or after stimulation with PMA/ionomycin for each participant according to the cell population (p24+ and total CD4+ T cells). E. Phenotype of infected cells. The median fluorescence intensity (MFI) for each marker (HLA-ABC, Bcl2) is depicted ex vivo or after stimulation with PMA/ionomycin for each participant according to the cell population (p24+ and total CD4+ T cells). F. p24− cells were bulk sorted for total (LTR-gag) and integrated (alu/LTR-gag) HIV DNA quantification. Frequency of HIV DNA+ cells are presented in bar charts. Empty bars represent undetectable measures, and the limit of detection is plotted. G. Frequencies of CD4+ T cells harboring unintegrated HIV DNA, integrated HIV DNA and producing p24 proteins during untreated HIV infection. Integrated HIV DNA was measured by alu/LTR-gag PCR. Unintegrated HIV DNA was evaluated by subtracting the measure of integrated HIV DNA from the measure of total HIV DNA. Frequencies of p24+ cells were measured by HIV-Flow. All samples from participants from whom NFL HIV genome sequences were obtained are shown. For each sample, measures performed ex vivo and after 24h stimulation with PMA/ionomycin are represented.

