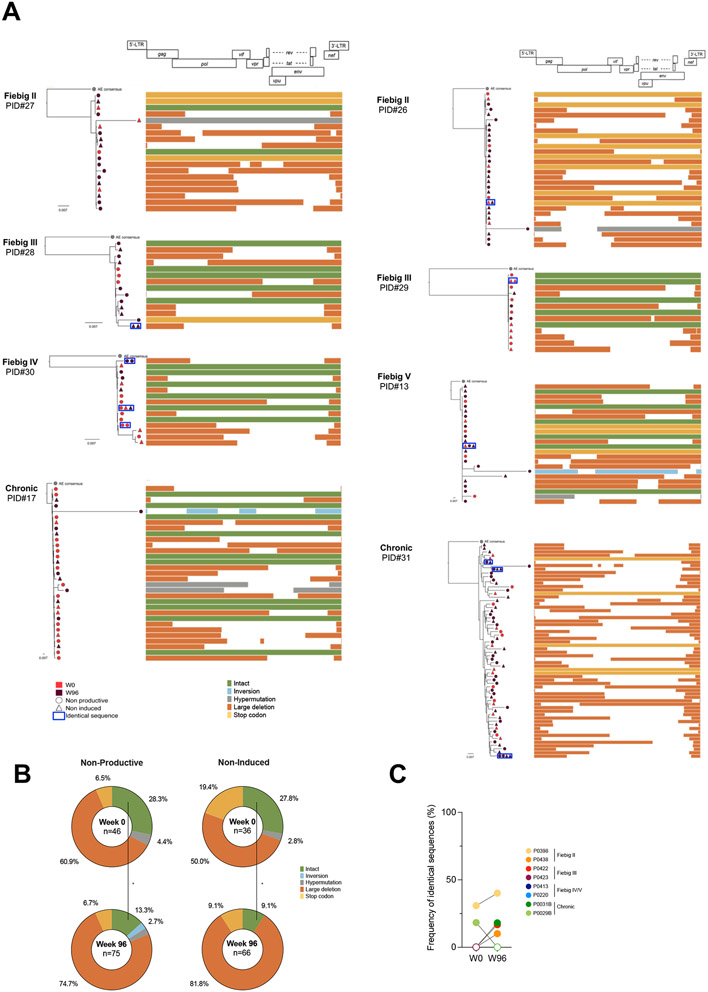
Fig. 7. Intact and non-inducible proviruses are established during acute infection and persist on ART.
A. Near-full length genome amplification was performed in p24− cells to assess the intactness of latent genomes. To assess the inducibility of these proviruses, p24− cells from both the ex vivo and stimulation conditions were included (n=8 participants). Phylogenetic trees representing the proviral landscape of five participants are depicted. Sequences obtained before (week 0, red) and during suppressive ART time point (week 96, burgundy) are included; Sequences obtained from p24− cells sorted directly ex vivo (circle) or after stimulation (triangle), representing the non-productive and the non-induced latent HIV reservoirs, respectively, are also included. Identical sequences are framed and represented on the same tree branch. On the right of the graph, proviral sequences are mapped to the HIV genome, and color-coded as follows: intact sequences in green, inversions in blue, hypermutations in grey, large deletions in orange and stop codons in yellow. B. Pie charts summarizing the frequency of defects and intact proviruses obtained from p24− cells sorted ex vivo (non-productive) and after stimulation (non-induced) before (week 0, n=8) and after ART initiation (week 96, n =8). The total number of sequences per condition is indicated at the center of the pie (sequence color categories are as in A.). C. The frequency of identical proviral sequences before and after ART in p24- cells is represented for each participant. Significant differences are highlighted (Wilcoxon or Fisher’s exact test; p<0.05, *; p<0.01**; p<0.001, ***; p<0.0001 ****).

