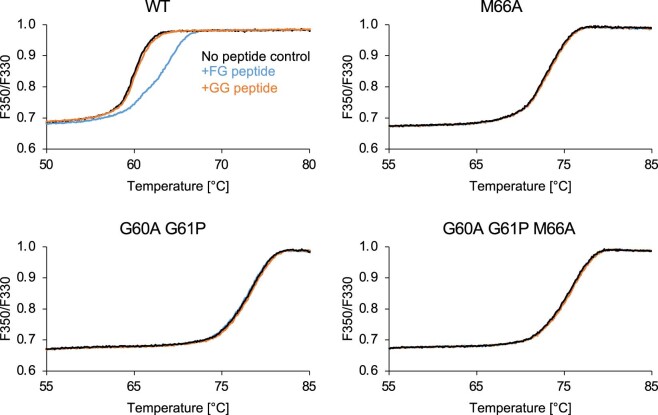
Extended Data Fig. 7. Representative raw thermal melting profiles.
Indicated CLPs (12–22 μM) were heated in the absence of peptide (black curves), in the presence of 500 μM FG peptide (blue curves) or in the presence of 500 μM GG peptide (orange curves). The FG peptide induced a clear shift in the melting profile of WT CLPs (upper left panel), thus indicating binding. In all other cases, the melting curves are virtually superimposable with their respective no-peptide controls, indicating lack of binding.

