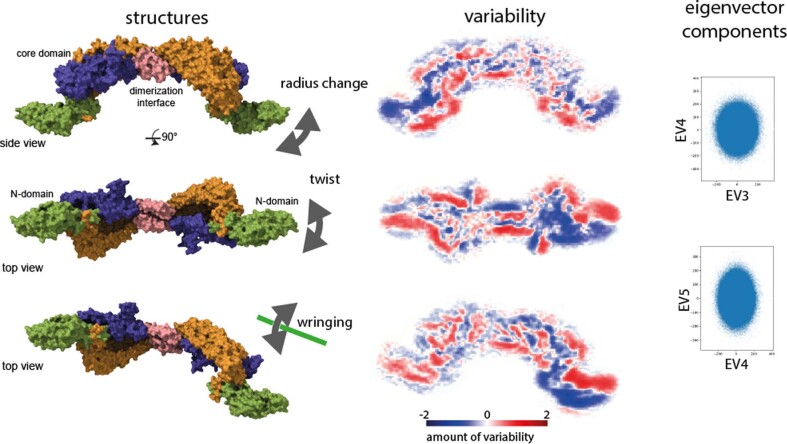
Extended Data Fig. 4. Flexibility of P116.
CryoEM classes display different flexibility modes. Individual reconstructions are shown on the left column. Their variability is shown in the middle column. Plotting of the individual eigenvector weights shows, that no clear distribution is visible and a smooth transition between the individual vibrational modes. Here ‘eigenvector 3’ (EV3) is plotted against ‘eigenvector 4’ (EV4) that display the largest resemblance to the radius change and ‘eigenvector 4’ (EV4) is plotted against ‘eigenvector 5’ (EV5) that display the largest resemblance to the twist.

