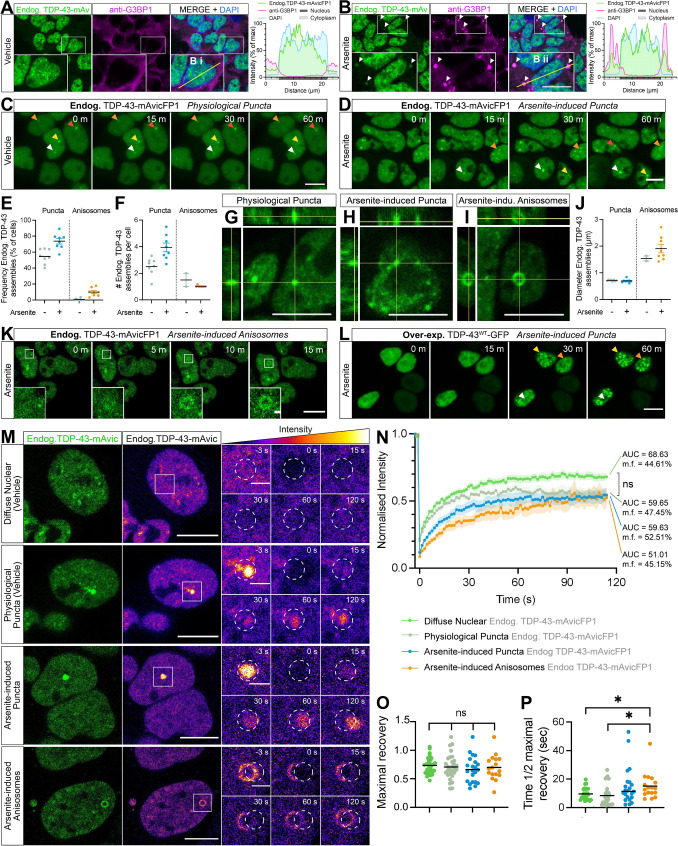
Fig. 4.
Endogenous CRISPR-tagged normal nuclear TDP-43 undergoes physiological or stress-induced self-assembly via liquid–liquid phase separation to form cytoplasmic stress granules or dynamic nuclear puncta and anisosomes in real-time. a, b Representative confocal micrographs with Z-stack maximum projection and intensity profiles of anti-G3BP1 labelling and TDP-43-mAvicFP1 in HEK293T:TARDBP-mAvicFP1 cells treated with vehicle or 50 µM sodium arsenite for 1 h. Inset zoomed view of cells measured for fluorescence intensity profiles; scale = 10 µm. c Live-cell imaging displays formation of stable physiological puncta with 1 h vehicle treatment, or d increased formation of nuclear puncta induced by 50 µM arsenite. e Frequency of cells with endogenous TDP-43-mAvicFP1 nuclear puncta and f number of puncta per cell. Data points represent the mean of all cells within an image, totalling 8 images per group. g 3-dimensional orthogonal projections of physiological nuclear puncta h arsenite-induced puncta, and i arsenite-induced anisosomes comprising endogenous TDP-43-mAvicFP1. j Diameter size in µm of puncta and anisosomes. Data points representing ‘per-image’ means. k Live-cell imaging of endogenous TDP-43-mAvicFP1 anisosome formation with 50 µm arsenite treatment. l Live-cell imaging of parental HEK293T cells over-expressing TDP-43WT-GFP with 50 µm arsenite treatment; scale large panels = 10 µm; zoomed panels = 1 µm. m FRAP quantification of endogenous TDP-43-mAvicFP1 mobility within distinct nuclear assemblies. Two large left panels depict endogenous TDP-43-mAvicFP1 singal with correct emission (green) on the left and pseudocoloured “fire” LUT to visualise intensity scale on the right; scale = 10 µm. Image intensities re-scaled between conditions to allow for side-by-side comparison of fluorescence recovery. Smaller panels display zoomed view with photo-bleached ROI outlined by white dashed circles, captured at −3, 0, 15, 30, 60 and 120 s post-bleaching; scale = 2 µm. n FRAP analysis displays normalised intensity during recovery over 120 s, along with mobility fraction (m.f.) values and area-under-the-curve (AUC) averaged for each cell, which was used for statistical comparison. Coloured lines represent mean of n = 3 biologically independent repeats, each striving for at least 5 cells, with shaded areas denoting standard error about the mean. o Maximal fluorescence recovery level relative to pre-bleaching intensity, and p time taken to recover to half of the maximal level for each of the TDP-43-mAvicFP1 assemblies. The same colour scheme as that of the intensity line graphs was used, with black lines representing the mean across n = 3 biologically independent repeats, and each point denoting individual cells. All data analysed with one-way ANOVA multiple comparisons with Tukey’s post hoc test, relative to the ‘diffuse nuclear endogenous TDP-43-mAvicFP1’ control (*P < 0.05)

