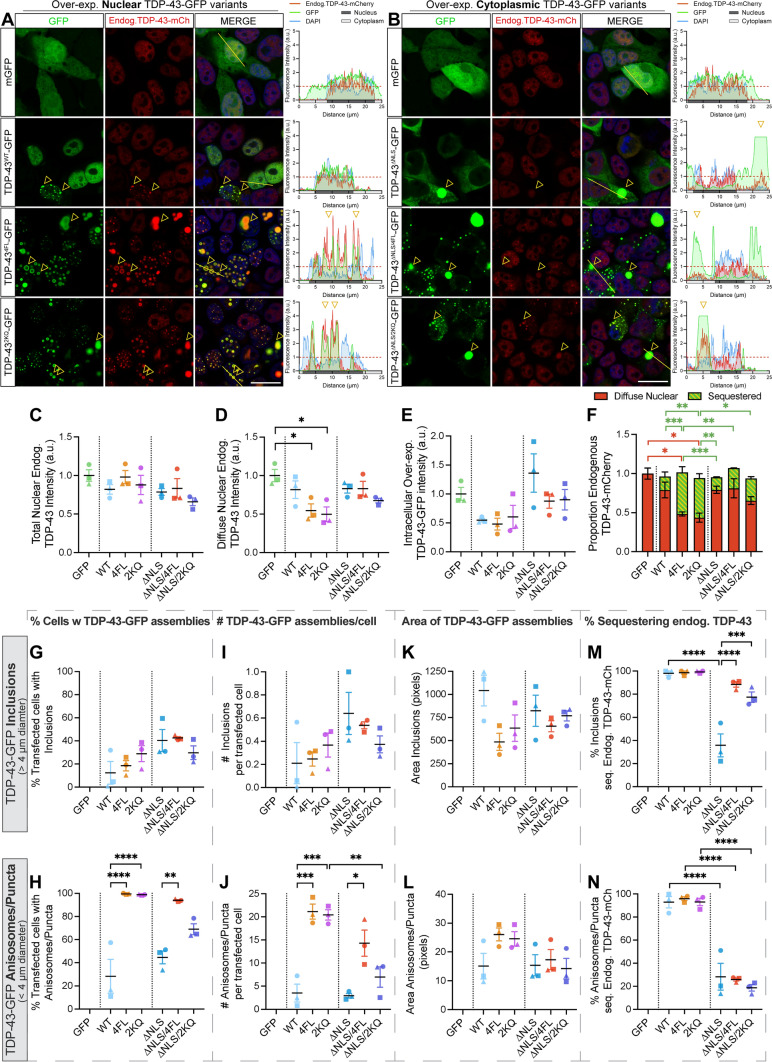
Fig. 5.
Nuclear or cytoplasmic RNA-binding-ablated or acetylation-mimicking TDP-43 decreases endogenous TDP-43 levels and recruits endogenous TDP-43 to puncta and inclusions. a, b Confocal images of HEK293T:TARDBP-mCherry cells over-expressing a nuclear or b cytoplasmic TDP-43-GFP variants after 48 h, and assemblies that sequester endogenous TDP-43-mCherry (yellow arrowheads). Right-hand panels display relative fluorescence intensity profiles of example cells (left-to-right along yellow line), with yellow arrowheads demonstrating position of sequestering assemblies. Red lines denote the mean intensity level of each channel in GFP-transfected control cells, to which other intensities are normalised. c–f CellProfiler image segmentation analysis was used to quantify intensities of c total nuclear or d diffuse nuclear endogenous TDP-43-mCherry proteins, and e intracellular levels of over-expressed TDP-43-GFP protein variants in transfected cells. Each point represents the mean relative fold change from GFP-transfected control cells, sampling cells from 8 regions-of-interest at × 63 magnification, for each of n = 3 biologically independent repeats, denoted by different point shapes. f Stacked bar graph demonstrating the proportions of endogenous TDP-43 diffusely distributed in the nucleus (red) or sequestered into nuclear or cytoplasmic TDP-43-GFP aggregates (green). g–n CellProfiler image segmentation was used to quantify parameters of aggregates formed by over-expression of TDP-43-GFP variants. Inclusions were defined as large bright speckles with intensity above 60% of saturation point and minimum diameter of 4 µm. Anisosomes/puncta were defined as speckles with intensity above 25% of saturation point and diameter of 0.5–4 µm. g, h Proportion of transfected cells with inclusions or puncta. i, j Number of inclusions or puncta per transfected cell. k, l Area of inclusions or puncta. m, n Proportion of inclusions or puncta sequestering endogenous TDP-43, respectively. Inclusions or puncta sequestering endogenous TDP-43-mCherry defined as those with endogenous TDP-43-mCherry intensity above the lower quartile intensity of diffusely-distributed nuclear endogenous TDP-43-mCherry in GFP-transfected control cells. Cell numbers and replicates as per (C-E). Statistically significant differences between the means were analysed as one-way ANOVA multiple comparisons with Tukey’s post hoc test (*P < 0.05, **P < 0.01, ***P < 0.001, ****P < 0.0001)

