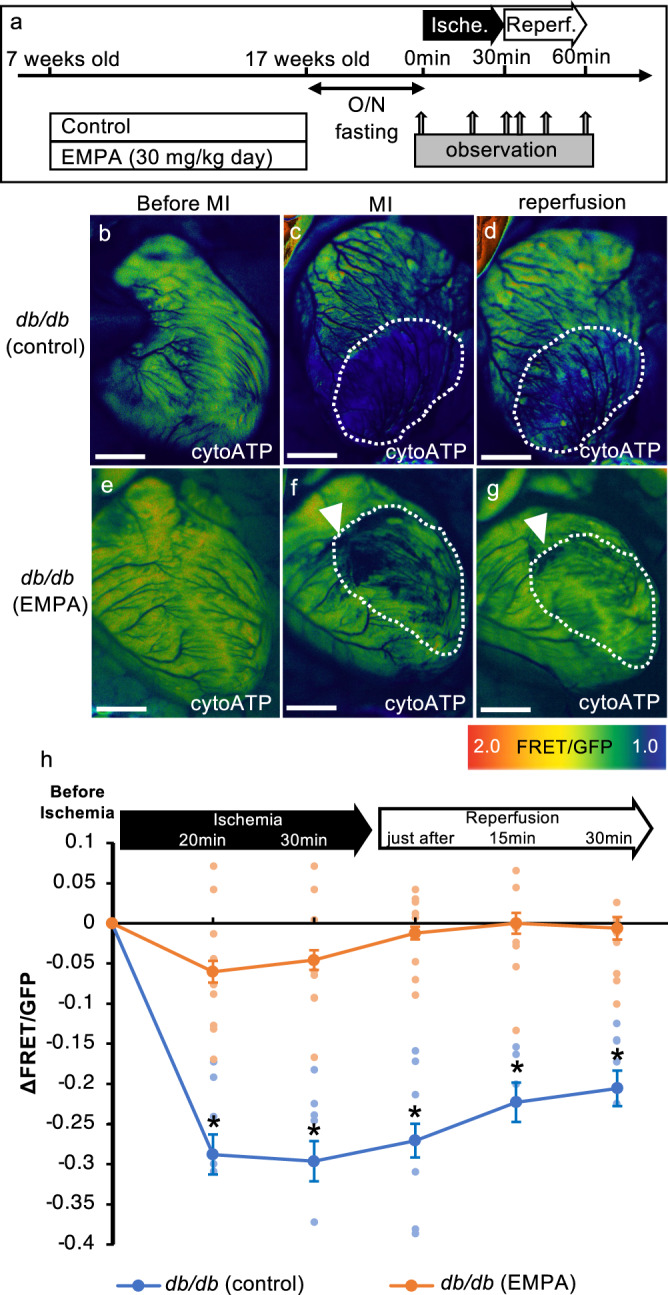
Fig. 2. Chronic treatment with empagliflozin is cardioprotective by maintaining cytosolic ATP levels in the infarcted region of T2D hearts.

a Schematic illustration of the treatment regimen (EMPA empagliflozin). b–g Fluorescence images of a live heart from each condition (EMPA empagliflozin). Arrowheads show the sites of punctuation with a suture needle to induce ischemia. Dotted lines show the infarct regions. Warmer colors indicate higher ATP concentrations. Scale bar: 2 mm. h Time course changes in FRET/GFP ratios in the ischemic region during ischemia and reperfusion (db/db [control]: n = 6, db/db [EMPA]: n = 9; ischemia 20 min: *p = 0.001, ischemia 30 min: *p = 0.000, just after reperfusion: *p = 0.000, 15 min after reperfusion: *p = 0.001, 30 min after reperfusion: *p = 0.001).
