Figure 2.
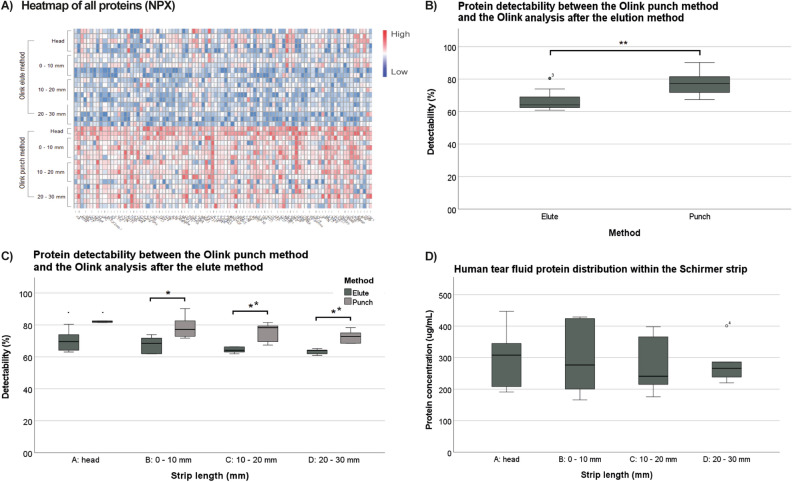
Protein detectability using the punch method versus elution of tear fluid Schirmer strips. (A) Heatmap of protein expression level (normalized protein expression (NPX)) of 92 proteins tested with the Olink Target 96 panel. Individual proteins are depicted on the X-axis, while samples of the different pre-processing methods and locations are shown on the Y-axis. (B) The boxplots depict the protein detectability (% of proteins of a total number of 92 proteins above the lower limit of detection) between the punch and elution method. Overall, protein detectability is significantly higher in the punch method compared to the elution method (p = 0.002). (C) Protein detectability of different locations of the strip using the punch method (A: 82 ± 0.8%; B: 79 ± 7.6%; C: 75 ± 6.3%; D: 73 ± 4.2%) and the elution method (A: 70 ± 7.2%; B: 68 ± 5.5%; C: 64% ± 1.9%; D: 63 ± 1.8%) showed significant differences (A: p = –; B: p = 0.028; C: p = 0.006; D: p = 0.002). Protein detectability was not significantly different between the locations of the strip for the elute method (p = 0.122) as well as for the punch method (p = 0.231). Three out of twenty Schirmer strip pieces did not pass the quality control and were excluded in 2A, 2B, and 2C. These three Schirmer strip pieces were all from location A of the punch method. (D) The boxplot depicts the total protein concentration found in the different Schirmer strip locations. Total protein concentration, measured by the bicinchoninic acid assay (BCA), was similar between all locations of the Schirmer’s strip. Surface area difference of location A vs the other locations of the strip was corrected for with the correction factor = 4/π.

