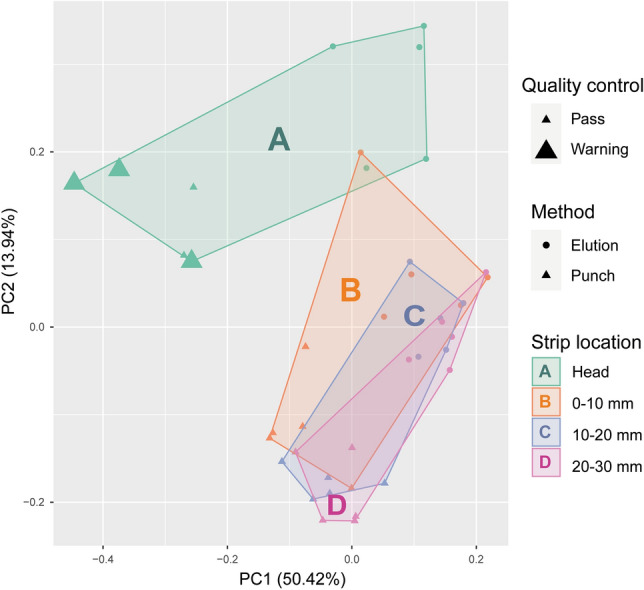
Figure 3.

Principal component analysis of the protein composition (92 proteins) of different locations of the strips using the punch versus elution method. Scatterplot of the first two principal components based on Z-score scaled protein composition of all samples (n = 20*2) measured by the Olink Target 96 Inflammation panel. Location A (head of the strip) groups differently than Schirmer strip locations B, C and D, most noticeably the punch method location A groups separately. The samples with bold symbols provided a warning on the Olink proteomics quality control, which reflects the possible interference of proteins in these samples with the internal control.
