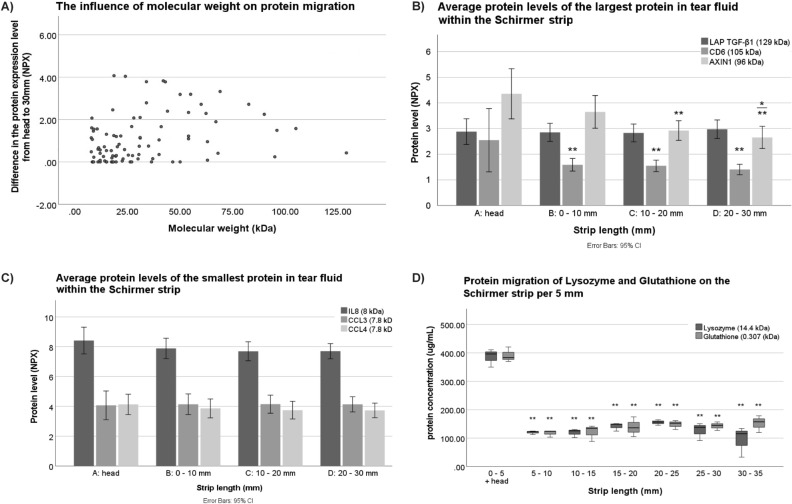
Figure 4.
The influence of the molecular weight on protein migration over tear fluid Schirmer strips. (A) Scatterplot of the difference in protein expression level (NPX) of the head, location A, compared to location D, against the protein molecular weight. (Pearson rho = 0.227; p = 0.009). (B) Significant differences were found in the protein migration of cluster of differentiation 6 (CD6) (location A vs B: p = 0.001; A vs C: p = 4.72 ∙ 10–4; A vs D: p = 1.27 ∙ 10–4), and Axin-1 (location A vs C : p = 0.006; A vs D: p = 0.001; B vs D: p = 0.034). (C) No significant differences were found in the protein migration over the strip of interleukin-8 (IL8), chemokine ligand 3 (CCL3), and chemokine ligand 4 (CCL4). (D) The protein migration of spiked lysozyme (14.4 kDa) and glutathione (0.307 kDa) is displayed in the boxplots. A significant difference in protein concentration was found with respect to the migration of both lysozyme (head–5 mm vs 5–10 mm: p = 2.29∙10–7; head–5 mm vs 10–15 mm: p = 2.19∙10–7; head–5 mm vs 15–20 mm: p = 6.63∙10–7; head–5 mm vs 20–25 mm: p = 0.1∙10–5; head–5 mm vs 25–30 mm: p = 3.21∙10 -7; head–5 mm vs 30–35 mm: p = 6.91∙10–8) and glutathione (head–5 mm vs 5–10 mm: p = 3.12∙10–8; head–5 mm vs 10–15 mm: p = 3.83∙10–8; head–5 mm vs 15–20 mm: p = 8.99∙10–8; head–5 mm vs 20–25 mm: p = 1.45∙10–7; head–5 mm vs 25–30 mm: p = 1.11∙10–7; head–5 mm vs 30–35 mm: p = 1.78∙10–7).

