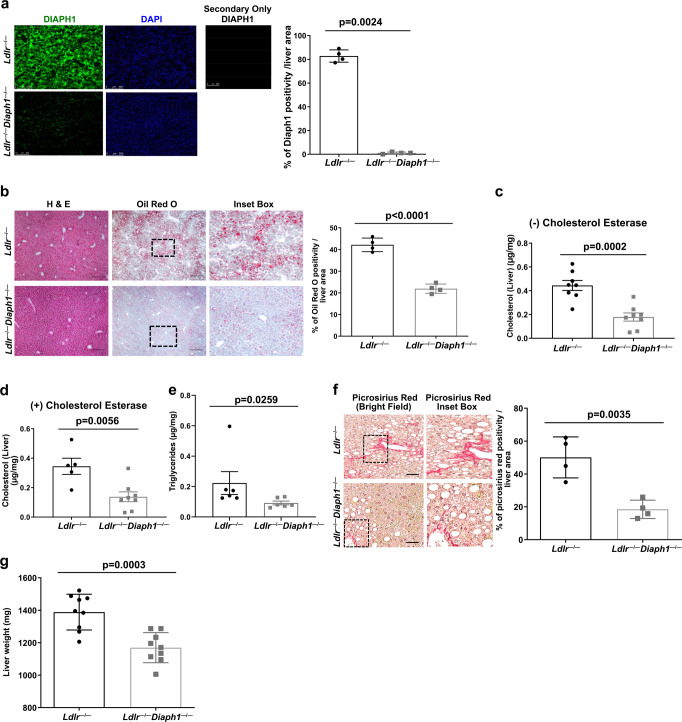
Fig. 3. Deletion of Diaph1 in Ldlr−/− mice reduces hepatic lipid content and liver fibrosis.
Ldlr−/− and Ldlr−/− Diaph1−/− male mice were fed WD for 16 weeks. a Representative immunofluorescence staining and quantification of DIAPH1 in the liver of Ldlr −/− and Ldlr−/− Diaph1−/− male mice. b Representative images of H&E and Oil Red O staining in liver and quantification is shown. c Quantification of free cholesterol content in liver. d Quantification of total cholesterol content in liver. e Quantification of total liver triglycerides. f Representative images of Picrosirius Red staining in liver and quantification is shown. g Quantification of whole liver weight. The mean ± SEM is reported. The number of independent mice/group is indicated in the figure as individual data points. In a the secondary antibody–alone control is shown. Scale bars: 250 µm, and inset boxes: 50 µm. Statistical analyses regarding testing for the normality of data followed by appropriate statistical analyses were described in Materials and Methods. P-values were determined by unpaired T-test or Wilcoxon rank-sum test depending on if the data passed the Shapiro-Wilk normality test.

