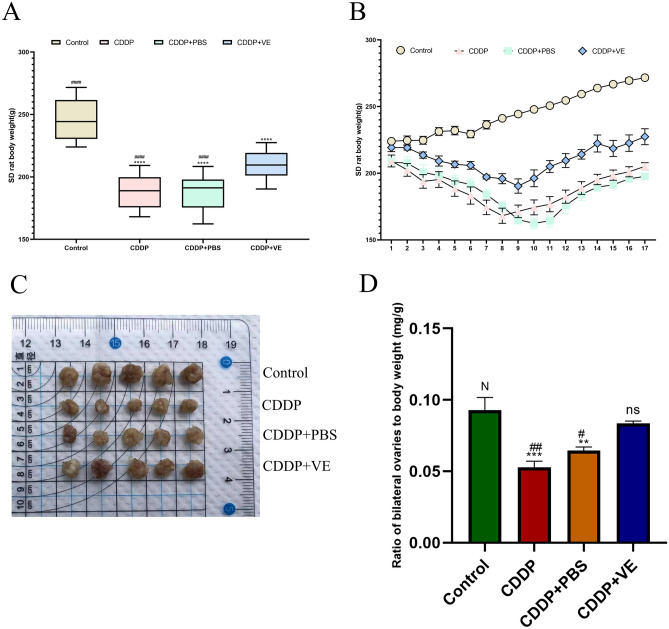
Figure 1.
Body and ovary weights of rats. (A, B) Body weight changes trend of rats in each group. (C, D) Ovarian size and the ratio of bilateral ovaries to body weight in each group. Data are expressed as the means ± SEM. n = 20, ns, * versus control, *P < 0.05, **P < 0.01, ***P < 0.001 and ****P < 0.0001, ns indicates no statistical significance. N, # versus CDDP + VE, # P < 0.05, ## P < 0.01, ###P < 0.001 and #### P < 0.0001, N indicates no statistical significance.

