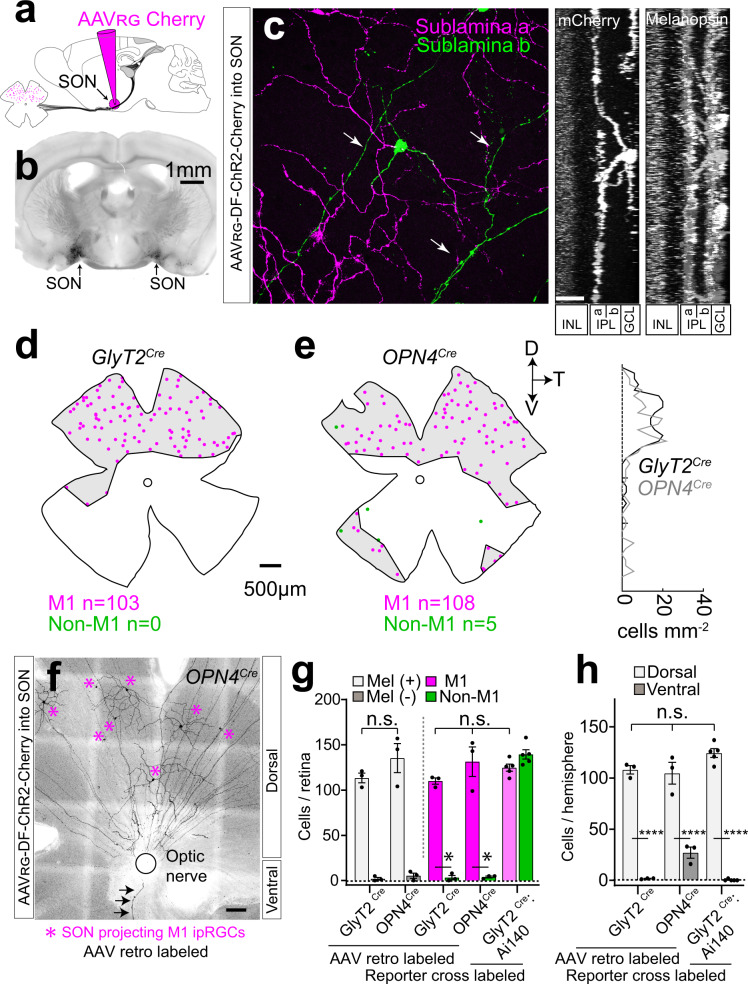
Fig. 6. GlyT2Cre ipRGCs form the principle projection to the SON.
a, b Stereotactic injections of Cre-dependent retroAAV into the SON labels a population of ipRGCs. c Confocal micrograph (left) and side z-projections (right) illustrate that retro-labeled cells are M1 ipRGCs; with dendrites that stratify in sublamina-a of the inner plexiform layer (IPL). Arrows indicate axons in the ganglion cell layer (GCL) INL = inner nuclear layer. d Distribution maps of retro-labeled ipRGCs in GlyT2Cre and e OPN4Cre mouse lines. The density at each retinal location along the dorso-ventral axis is plotted on the right. f Confocal micrograph illustrates dorsal retro-labeled SON-projecting M1 ipRGCs (asterisks) in the OPN4Cre mouse and a single ventral axon (arrows). g Bar graphs of ipRGCs per retina that are melanopsin-positive or negative (left; error bars ± SEM p = 0.2633) and M1 ipRGCs or non-M1 ipRGCs in SON-injected GlyT2Cre and OPN4Cre mice retinas labeled with SON injections of retroAAV (data were presented as mean values ± SEM; n = 3 retina from n = 2 GlyT2Cre animals, n = 3 retina from n = 3 OPN4Cre animals, n = 5 retina from n = 3 GlyT2Cre;Ai140 animals; left/middle p = 0.1577, middle/right 0.339 and left/right 0.8762). ipRGCs identified in GlyT2Cre;Ai140 retinas quantified for comparison. h Bar graphs of a population of ipRGCs per hemisphere in the SON-injected GlyT2Cre and OPN4Cre mouse retinas. GlyT2Cre;Ai140 retinas quantified for comparison (data are presented as mean values ± SEM; n = 3 retina from n = 2 GlyT2Cre animals, n = 3 retina from n = 3 OPN4Cre animals, n = 5 retina from n = 3 GlyT2Cre;Ai140 animals, ****p = <0.0001, ns left/middle p = 0.9985, left/right 0.1445, and middle/right 0.0541). Data were presented as mean values ± SEM. Statistical significance for g, right, and h was assessed using one-way ANOVA with Šídák’s multiple comparisons test and for g left using an unpaired two-tailed t-test. Scale bars in c = 20 μm, d, e = 500 μm, f = 100 μm. Source data are provided as a source data file.

