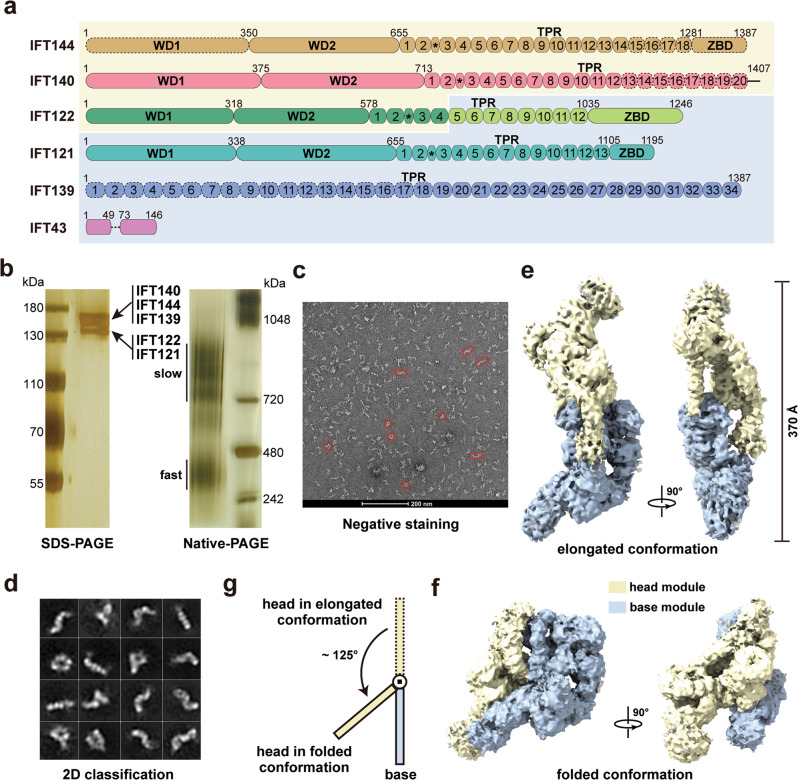
Fig. 1. Overall structure of the IFT-A complex in two different conformations.
a Domain organizations of the IFT-A components. IFT144, IFT140, IFT122N, IFT122C, IFT121, IFT139 and IFT43 are colored goldenrod, salmon, green, green yellow, turquoise, blue and violet, respectively. Black asterisks indicate the helices inserted between the second and third TPR repeats in IFT144, IFT140, IFT122, and IFT121. The head and base module components have light yellow and pale blue background colors, respectively. Models of IFT144WD1, IFT144C, IFT140C and IFT139N built with the aid of AlphaFold-2 are shown in dashed ovals or circles. The middle disordered loop of IFT43 is shown in a dashed line. b Silver staining SDS-PAGE gel (left) and native-PAGE gel (right) showing the purity and major conformations of the purified IFT-A complex. Each experiment was repeated three times independently with similar results. c A representative negative staining image of the IFT-A complex. Two different conformations of the particles are marked with red rectangle and circle, respectively. d 2D class averages of the negative staining images of the IFT-A complex. Cryo-EM density maps of the elongated (e) and folded (f) IFT-A complex in two orthogonal views. The head and base modules are colored in light yellow and pale blue, respectively. g A schematic diagram showing the conformational change of the head module from the elongated to the folded state. Source data are provided as a Source Data file.

