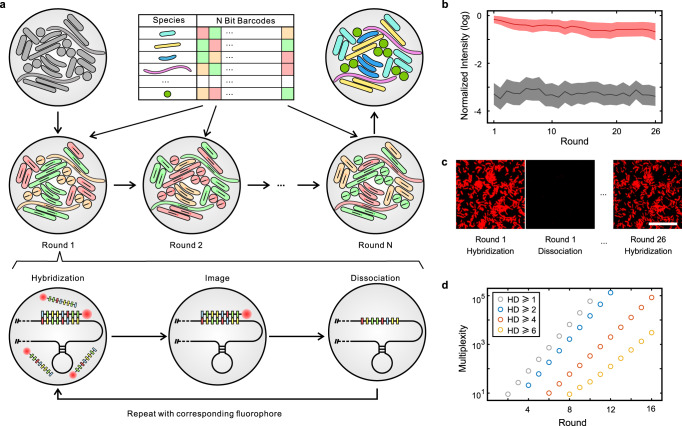
Fig. 1. SEER-FISH allows superior multiplexity in spatial profiling of microbiomes.
a Design of SEER-FISH. Each bacterial taxon is encoded by an F-color N-bit barcode. The spatial distribution of the microbial community can be obtained through R rounds of FISH. Each round of SEER-FISH includes probe hybridization, imaging, and probe dissociation (see Multi-round FISH imaging in Methods, Supplementary Fig. 1a). b, c Fluorescence intensity over 26 rounds of SEER-FISH. Lines indicate the mean fluorescence intensity (log-transformed and normalized by the maximum pixel value of CCD) of bacterial cells (n = 2257) after hybridization (red line) and dissociation (black line), respectively. The shadow of each line indicates the standard deviation. Fluorescence intensity at the 1st and 26th rounds of imaging is shown in panel c. Scale bar, 25 μm. d The multiplexity of SEER-FISH increases exponentially with the number of rounds. The colors of the circles indicate the minimal Hamming distance (HD) between barcodes. All codebooks are generated with three colors (F = 3). Source data are provided as a Source Data file.

