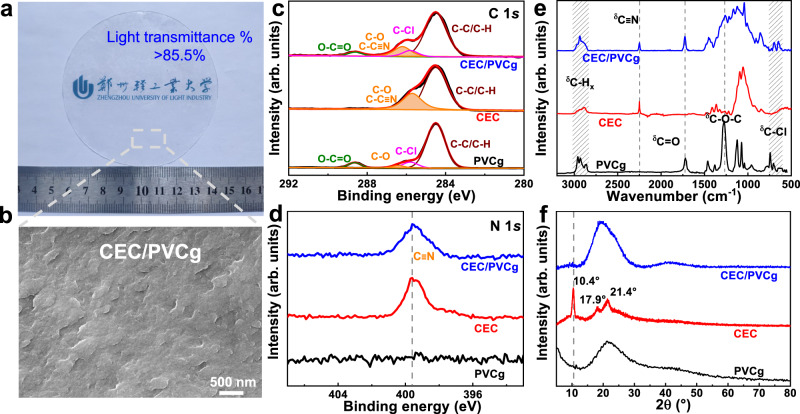
Fig. 2. Physicochemical characterization of CEC/PVCg.
An optical image (a) and cross-sectional SEM image (b) of the transparent CEC/PVCg elastomer. High-resolution XPS spectra of C 1 s (c) and N 1 s (d) regions, FTIR spectra (e), and XRD diffraction patterns (f) of PVCg, CEC, and CEC/PVCg elastomer. The dashed lines indicated the major distinction among different samples, and the shadings represent the vibration regions. The signature of C≡N was shown at 286.2 eV in XPS C 1 s region, 399.6 eV in XPS N 1 s region, and FTIR absorption peak at 2250 cm−1.

