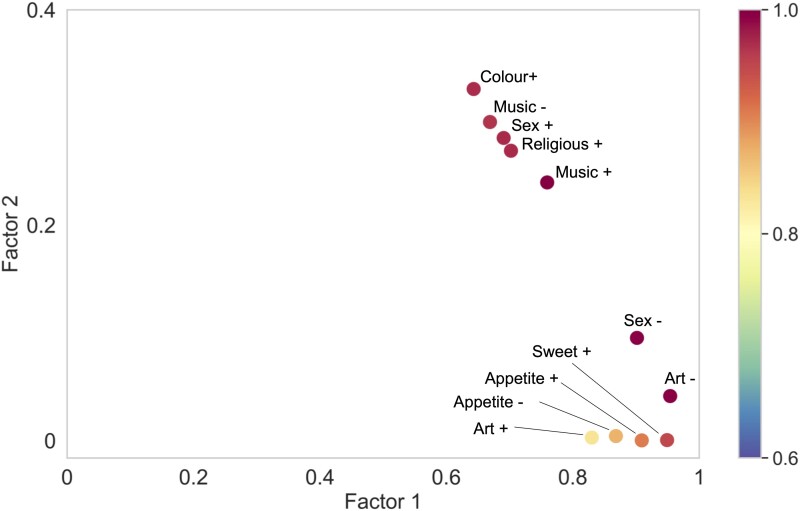
Figure 2.
Correlation of principal reward factors with reward behavioural changes. The plot shows the squared cosine values of each reward feature with the two principal reward factors, extracted from the MCA (n = 161 participants). The (x, y) coordinates here represent the squared cosines of each reward feature on factor 1 and factor 2, respectively; note change of scale between axes (see also Supplementary Table 4). The bar on the right codes the sum of squared cosines of factor 1 and 2 for each feature. The squared cosine value quantifies how strongly a feature is associated with a particular factor; it is related to distance along the factor axis from the origin in Fig. 1. Features with higher correlation values are better segregated from the ‘average’ feature profile of the study cohort by that factor. Appetite ±, appetite increased/decreased; Art ±, art responsiveness increased/decreased; Colour +, increased responsiveness to colours; Music ±, music responsiveness increased/decreased; Religious +, increased religiosity; Sex ±, libido increased/decreased; Sweet +, increased sweet tooth.

