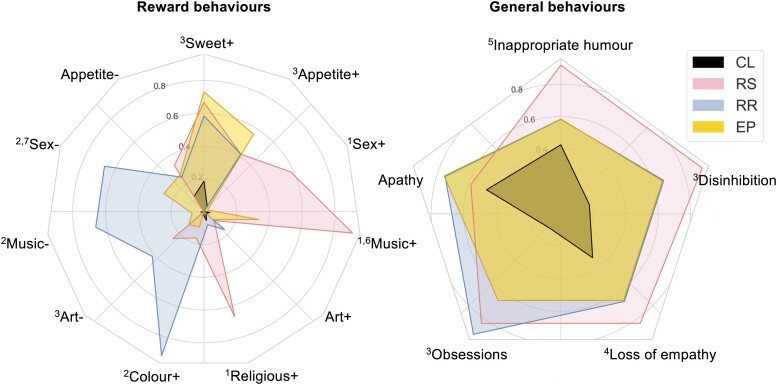
Figure 3.
Characteristics of reward behavioural phenotypic clusters. Radar plots depict the four reward behavioural phenotypic clusters in the combined patient cohort (n = 119 participants), the ‘reward-seeking’ (RS) cluster, the ‘reward-restricted’ (RR) cluster, the ‘eating-predominant’ (EP) cluster and the ‘control-like’ cluster (CL). Behavioural changes of interest are plotted around the circumference; concentric circles represent the proportion of participants exhibiting that change in each cluster (plotted along the radius). The left panel shows the proportion of participants in each cluster with particular reward features; the right panel shows the proportion of participants in each cluster with more general socio-emotional behavioural changes. Pair-wise comparisons between clusters using the chi-square test with post hoc correction (PFDR < 0.05) are coded as follows: 1RS > RR, EP, CL; 2RR > RS, EP CL;3RS, RR, EP > CL; 4RS, EP > CL; 5RS > CL; 6EP > RR, CL; 7EP > CL (see also Supplementary Tables 6 and 7). Appetite ±, appetite increased/decreased; Art ±, art responsiveness increased/decreased; Colour +, increased responsiveness to colours; Music ±, music responsiveness increased/decreased; CL, ‘control-like’ cluster; Religious +, increased religiosity; RR, ‘reward-restricted’ cluster; RS, ‘reward-seeking’ cluster; SC, ‘subtle change’ cluster; Sex ±, libido increased/decreased; Sweet +, increased sweet tooth.

