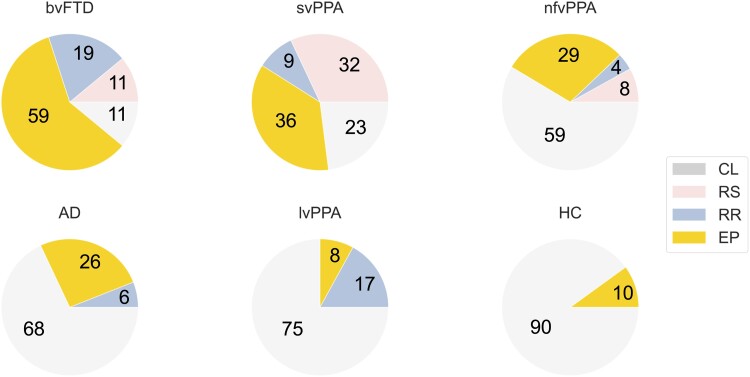
Figure 4.
Distribution of reward phenotypic clusters in dementia syndromes. Pie charts show the percentage of cases exhibiting each reward behavioural phenotypic cluster (see Fig. 3) in each diagnostic group. The number of participants in each diagnostic group was as follows: 27 bvFTD, 34 AD, 12 lvPPA, 22 svPPA, 24 nfvPPA and 42 HC. AD, patient group with typical Alzheimer’s disease; bvFTD, patient group with behavioural variant frontotemporal dementia; CL, ‘control-like’ cluster; EP, ‘eating-predominant’ cluster; HC, healthy control group; lvPPA, patient group with logopenic variant primary progressive aphasia; nfvPPA, patient group with non-fluent/agrammatic variant primary progressive aphasia; RR, ‘reward-restricted’ cluster; RS, ‘reward-seeking’ cluster; svPPA, semantic variant primary progressive aphasia.

