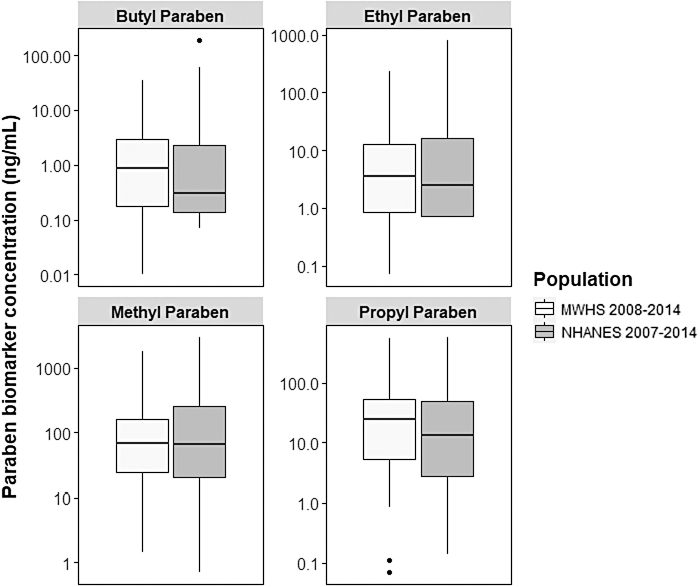
FIG. 1.
Urinary paraben biomarker concentrations in subsamples of MWHS and NHANES. Box plots display urinary paraben biomarker concentrations (ng/mL) of women in MWHS (2008–2014, N = 101) and same age non-Hispanic white, nonsmoking women from four NHANES survey cycles (2007–2014, n = 107). Box plots include the median (center line in box), the 25th percentile (lower line of box), and the 75th percentile (upper line in box). Dots represent extreme values. MWHS, Midlife Women's Health Study; NHANES, National Health and Nutrition Examination Survey.

