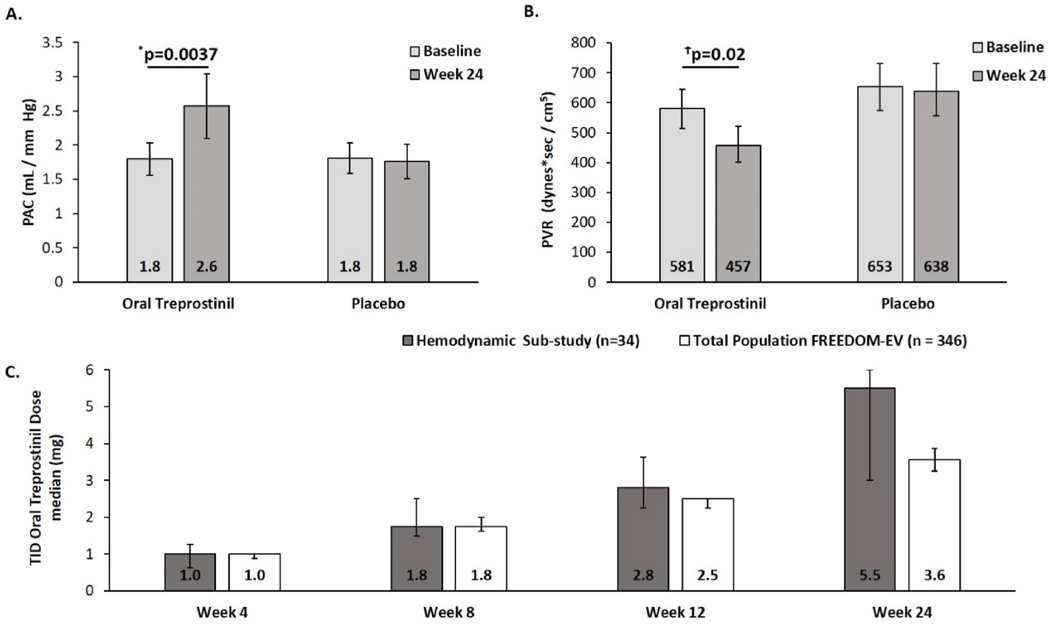
Fig. 1.
FREEDOM-EV Hemodynamic Sub-study. A) Mean (unadjusted) pulmonary arterial compliance increased by 44% from baseline to Week 24 in the oral treprostinil (n = 30) group versus 0% in the placebo (n = 24) group. Values represent means; error bars represent mean ± standard error B) Geometric mean (unadjusted) pulmonary vascular resistance dropped 21% from baseline to Week 24 in the oral treprostinil (n = 30) group versus 2% in the placebo (n = 24) group. Values represent geometric means; error bars represent geometric mean multiplied/divided by geometric standard error. C) Comparison of median dose for the hemodynamic sub-study to the total population of FREEDOM-EV over time. Error bars represent the 95% confidence interval. *p-value is obtained from the analysis of covariance with change from baseline in raw PAC as the dependent variable, treatment as fixed effect, and baseline raw PAC as a covariate. Ϯp-value is obtained from the analysis of covariance with change from baseline in log-transformed PVR as the dependent variable, treatment as fixed effect, and log-transformed baseline PVR as a covariate. PAC: pulmonary artery compliance; TID: three times a day; PVR: pulmonary vascular resistance.

