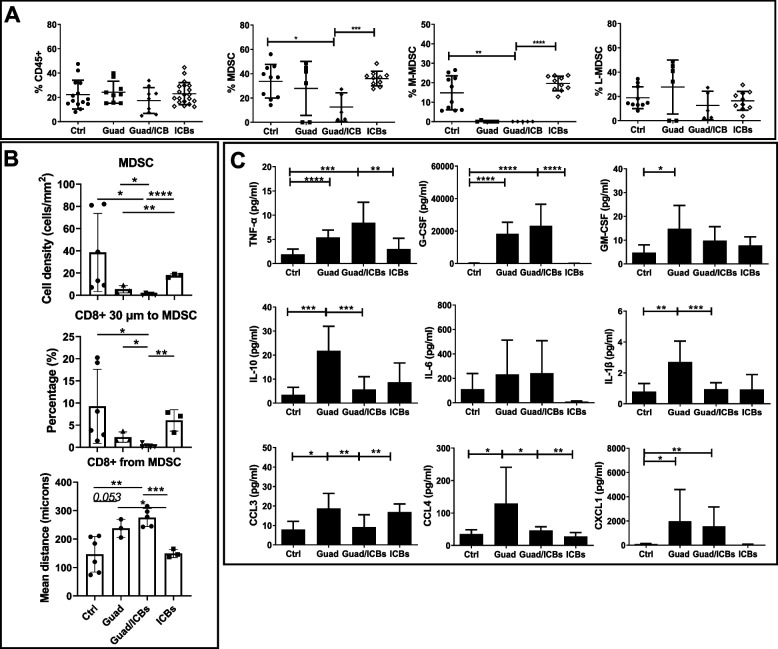
Fig. 8.
Effects of guadecitabine /ICBs on the percentages of MDSC in proximity to CD8+T cells and on cytokines/chemokine serum levels. A percentages of CD45+, MDSC and subsets: M-MDSC (Ly6C+Ly6G-/CD11b+) and G-MDSC (Ly6ClowLy6G+/CD11b+) in the lung from mice receiving different treatments. B mIF analysis of lung tumor tissue slides (n=6 mice/group) showing MDSC cell density (upper histogram), percentages of CD8+ T cells and MDSC (F480-Ly6G+Ly6C-) in a radius distance of 30µm (middle histogram), and mean distance between CD8+ T cells and MDSC (lower histogram) from mice receiving different treatments. C serum levels expressed in pg/ml of different cytokines (upper and middle row) or chemokines (lower row) analyzed by Milliplex assay (n=7 mice/group). *p<0.05, **p<0.02, ***p<0.01, ****p<0.001

