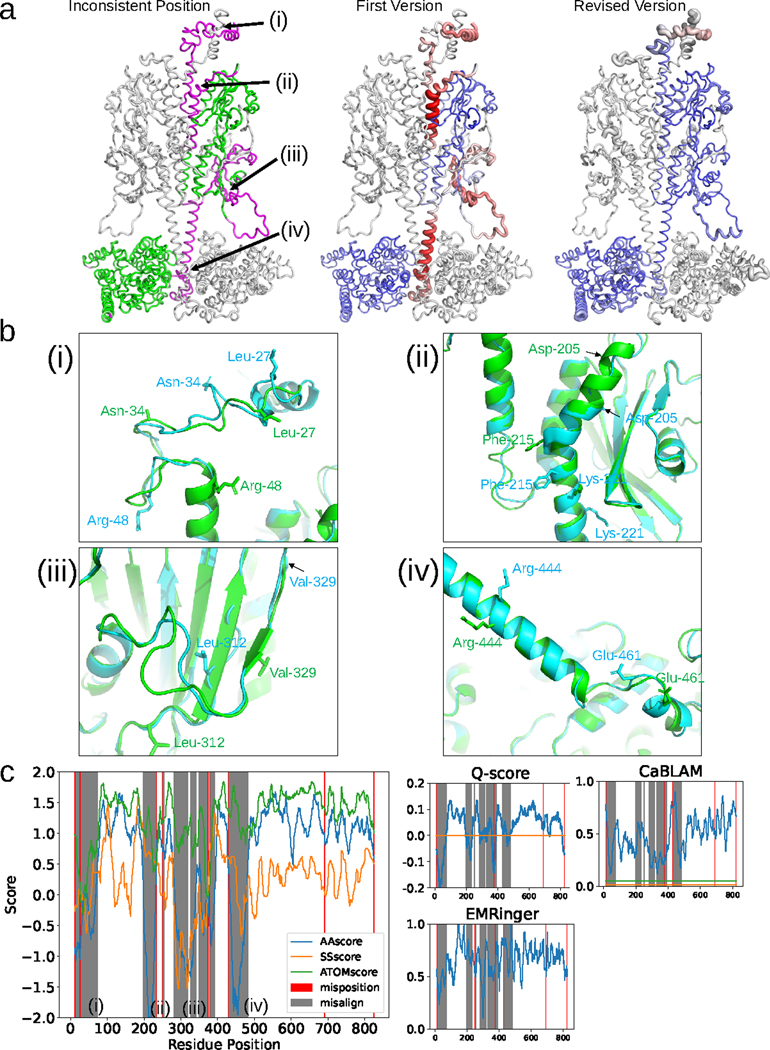
Fig. 3. Analysis of the DAQ score distribution for PDB entry 7JSN-B (EMD-22458).
a, Validation of the two versions of chain B deposited for entry 7JSN. Left: first version colored according to the deviation of the same Cα atom position in the revised version. Colors are scaled from green (deviation < 1.0 Å) to magenta (deviation > 4.0 Å). Middle and right: Structures of the first and revised versions, respectively. DAQ(AA) scores along the chain are shown in a color scale from red (DAQ(AA) < −2.0) to blue (DAQ(AA) > 2.0) with the width of the ribbon representation proportional to the absolute value of the DAQ(AA) score when it is negative. b, Four regions that exhibit large deviations between the two models are detailed. The first and revised versions of 7JSN chain B are shown in cyan and green, respectively. (i), residues 11–73. Three residues (Leu-27, Asn-34, and Arg-48) are highlighted with stick side chains to highlight their misplacement in the first version. (ii), residues 198–233. Three residues (Asp-205, Phe-215, and Lys-221) are shown with stick side chains as reference points to highlight misalignment. (iii), residues 282–391. Two residues (Leu-312 and Val-329) are shown with stick side chains to highlight misalignment. (iv), residues 431–483. Two residues (Arg-444 and Glu-461) are shown with stick side chains to highlight misalignment. c, DAQ scores and other validation metrics are shown as a function of sequence position. Left, three DAQ component scores are shown: DAQ(AA) (blue), DAQ(SS) (orange), and DAQ(Cα) (green). Misaligned and mispositioned residues are shaded gray and pink in the panel, respectively. The right three plots show results from three different validation scores: Q-score with the horizontal line of the expected Q-score (orange) for maps of this resolution, EMRinger, and CaBLAM with the outlier cutoff at the bottom 1% (orange) and the disfavored cutoff at bottom 5% (green), using a 19-residue sliding window.

