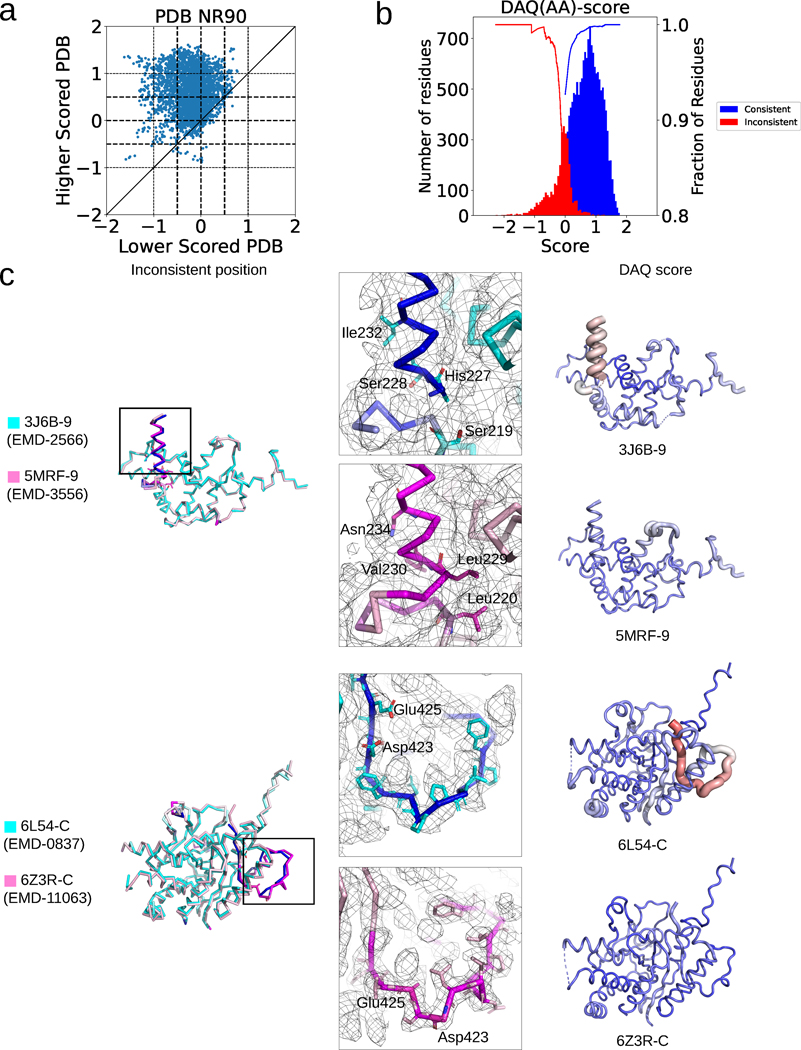
Fig. 4. DAQ score analysis of misaligned residues in the PDBNR90 dataset.
a. Comparison of the average DAQ(AA) score of inconsistent regions within 399 model pairs in the PDBNR90 dataset. A 19-residue-long window was used. b. DAQ(AA) score distribution of inconsistent (red) and consistent residues (blue) in the first version models in the PDB2Ver dataset. The inconsistent residues are residues that were modified in the revised model in PDB entries and thus more likely to be incorrect in one of the models. The two curves show the fraction of inconsistent residues with a score at a negative score cutoff or below (red) and the fraction of consistent residues with a positive score at the score cutoff or higher (blue) for the data in PDBNR90. c. Two examples of protein model pairs that have a large score difference. The left column shows the superposition of the pairs (cyan and pink). Inconsistent Cα atom positions (deviation > 4.0 Å) between the two models are indicated in blue and magenta in the cyan and pink models, respectively. Models in the middle and right columns correspond to the lower and higher scored PDB models, respectively. Surface meshes represent the EM map at author recommended contour levels. In models in the right column, DAQ(AA) score is indicated in colors from red (DAQ(AA) < −2.0) to blue (DAQ(AA) > 2.0) and by the radius of the tube (thicker being more negative).

