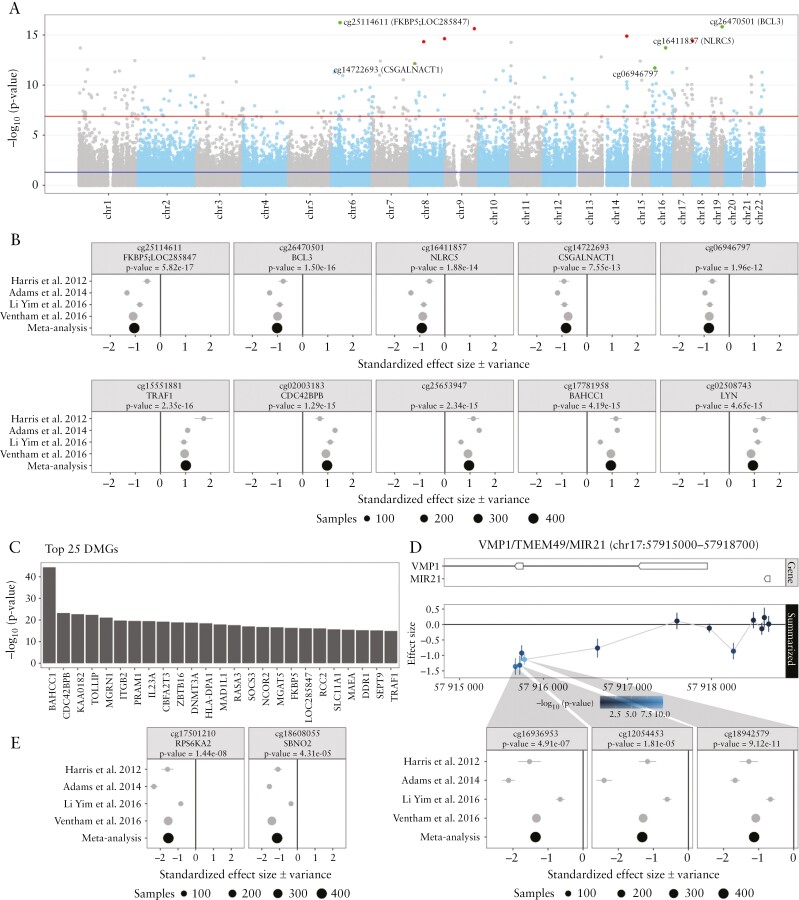
Figure 2.
Meta-analysis of the comparison Crohn’s disease [CD] with healthy controls [HC] using data from Harris et al. 2012, Adams et al. 2014, Li Yim et al. 2016 and Ventham et al. 2016. [A] A Manhattan plot representing the statistical significance depicted as −log10[p-value] on the y-axis relative to the location across the genome [hg19] on the x-axis. Red and green dots represent the five most significantly hyper- and hypomethylated differentially methylated probes [DMPs], respectively. [B] Forest plots representing the standardized effect size [SES] of interest per study of the five most significantly hyper- and hypomethylated DMPs annotated with the associated gene and p-value from the meta-analysis. [C] Barchart representing the top 25 most significant differentially methylated genes [DMGs]. The length of the bar is proportional to the −log10[p-value] obtained from the DMG analysis. [D] Genomic visualization and forest plots of the estimated difference in methylation for the DMPs cg16936953, cg12054453 and cg18942579, all of which have been associated with VMP1/TMEM49/MIR21. [E] Forest plots of DMPs cg17501210 and cg18608055, associated with RPS6KA2 and SBNO2, respectively, which had been reported on in multiple earlier studies.

