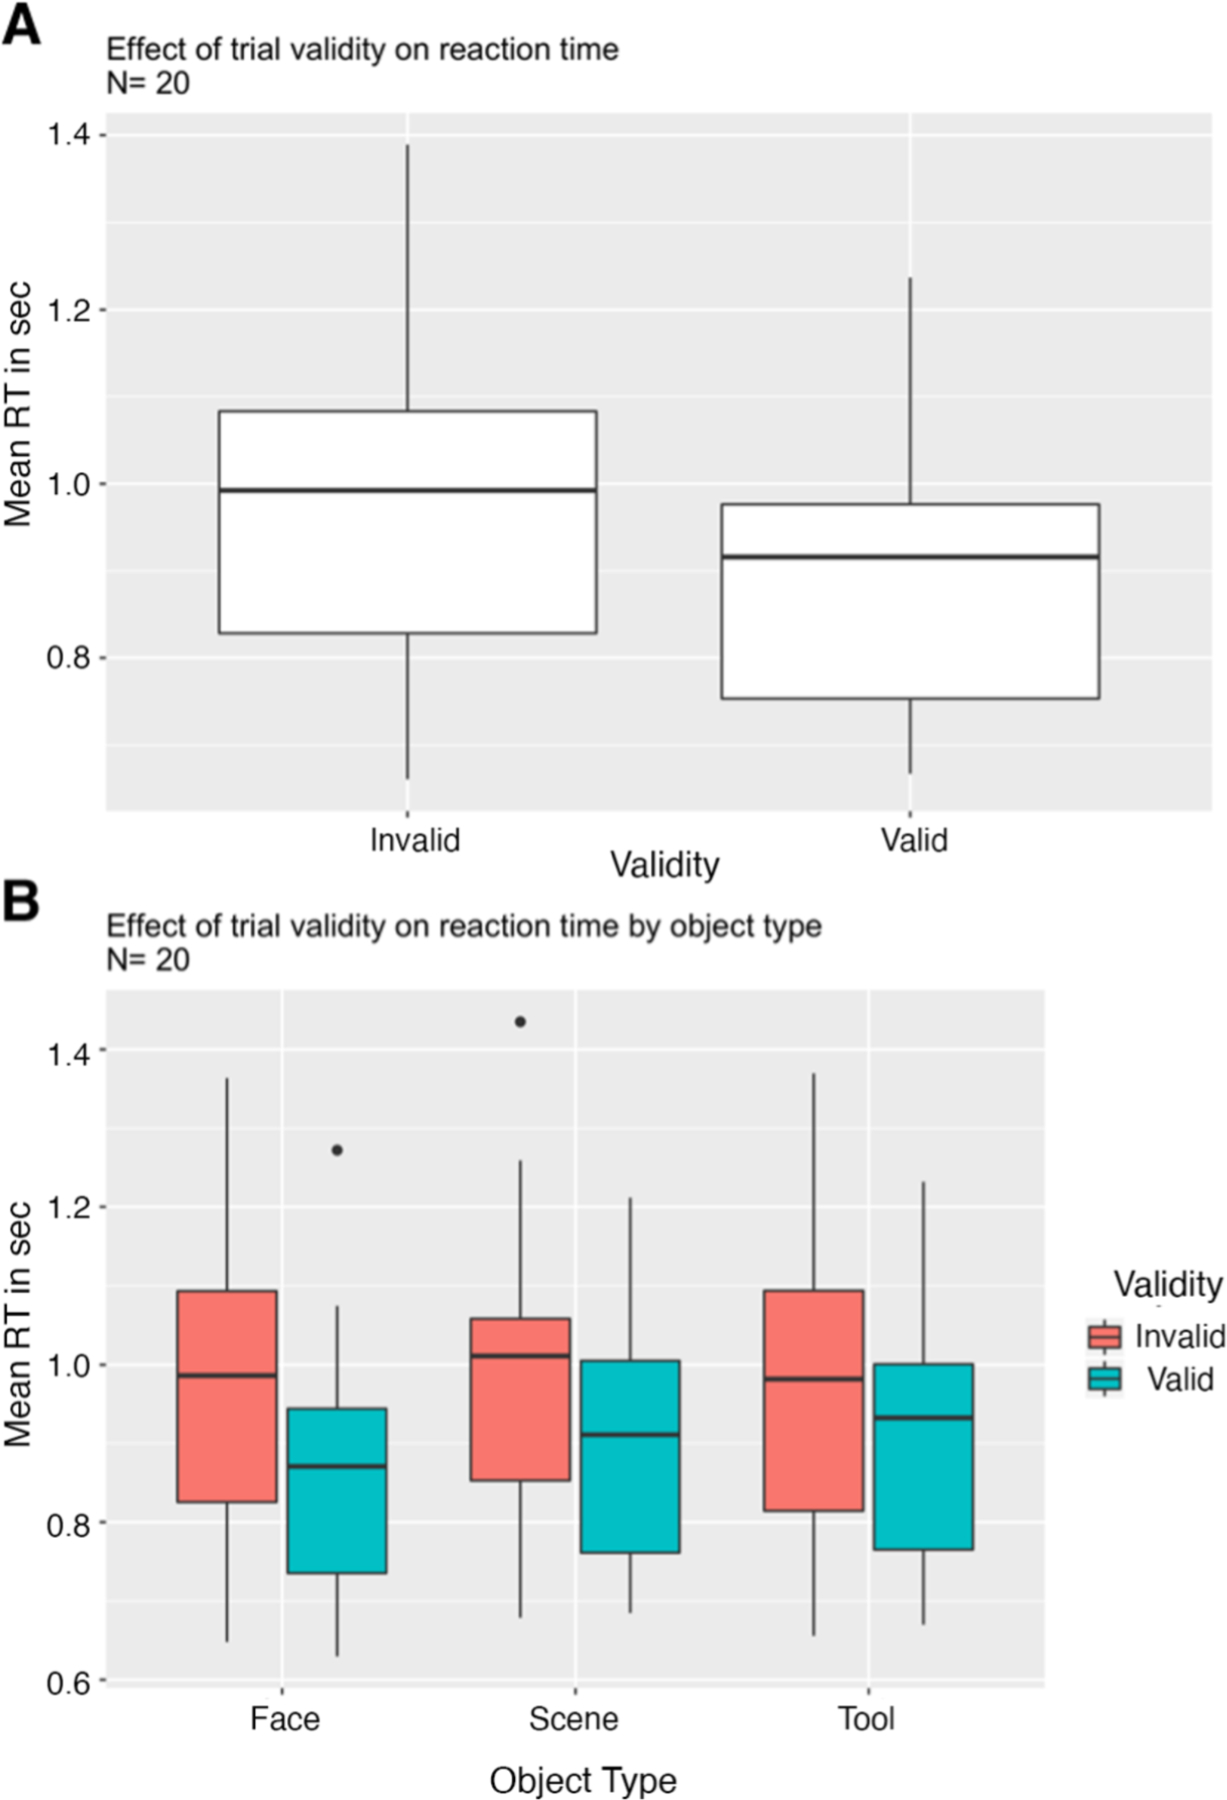
Figure 2. Behavioral Measures of Attention.

A. Box plots of reaction times for invalid and valid trials, collapsed across attention (object) conditions. Thick horizontal lines inside boxes represent median values. First and third quartiles are shown as lower and upper box edges. Vertical lines extend to most extreme data points excluding outliers. Dots above plots represent outliers, defined as any value greater than the third quartile plus 1.5 times the interquartile range. Subjects were significantly faster overall for cued (valid) objects than uncued (invalid) objects. B. Reaction times for valid and invalid trials separately for each attention condition. Subjects were significantly faster for cued (valid) objects than uncued (invalid) objects for each object category.
