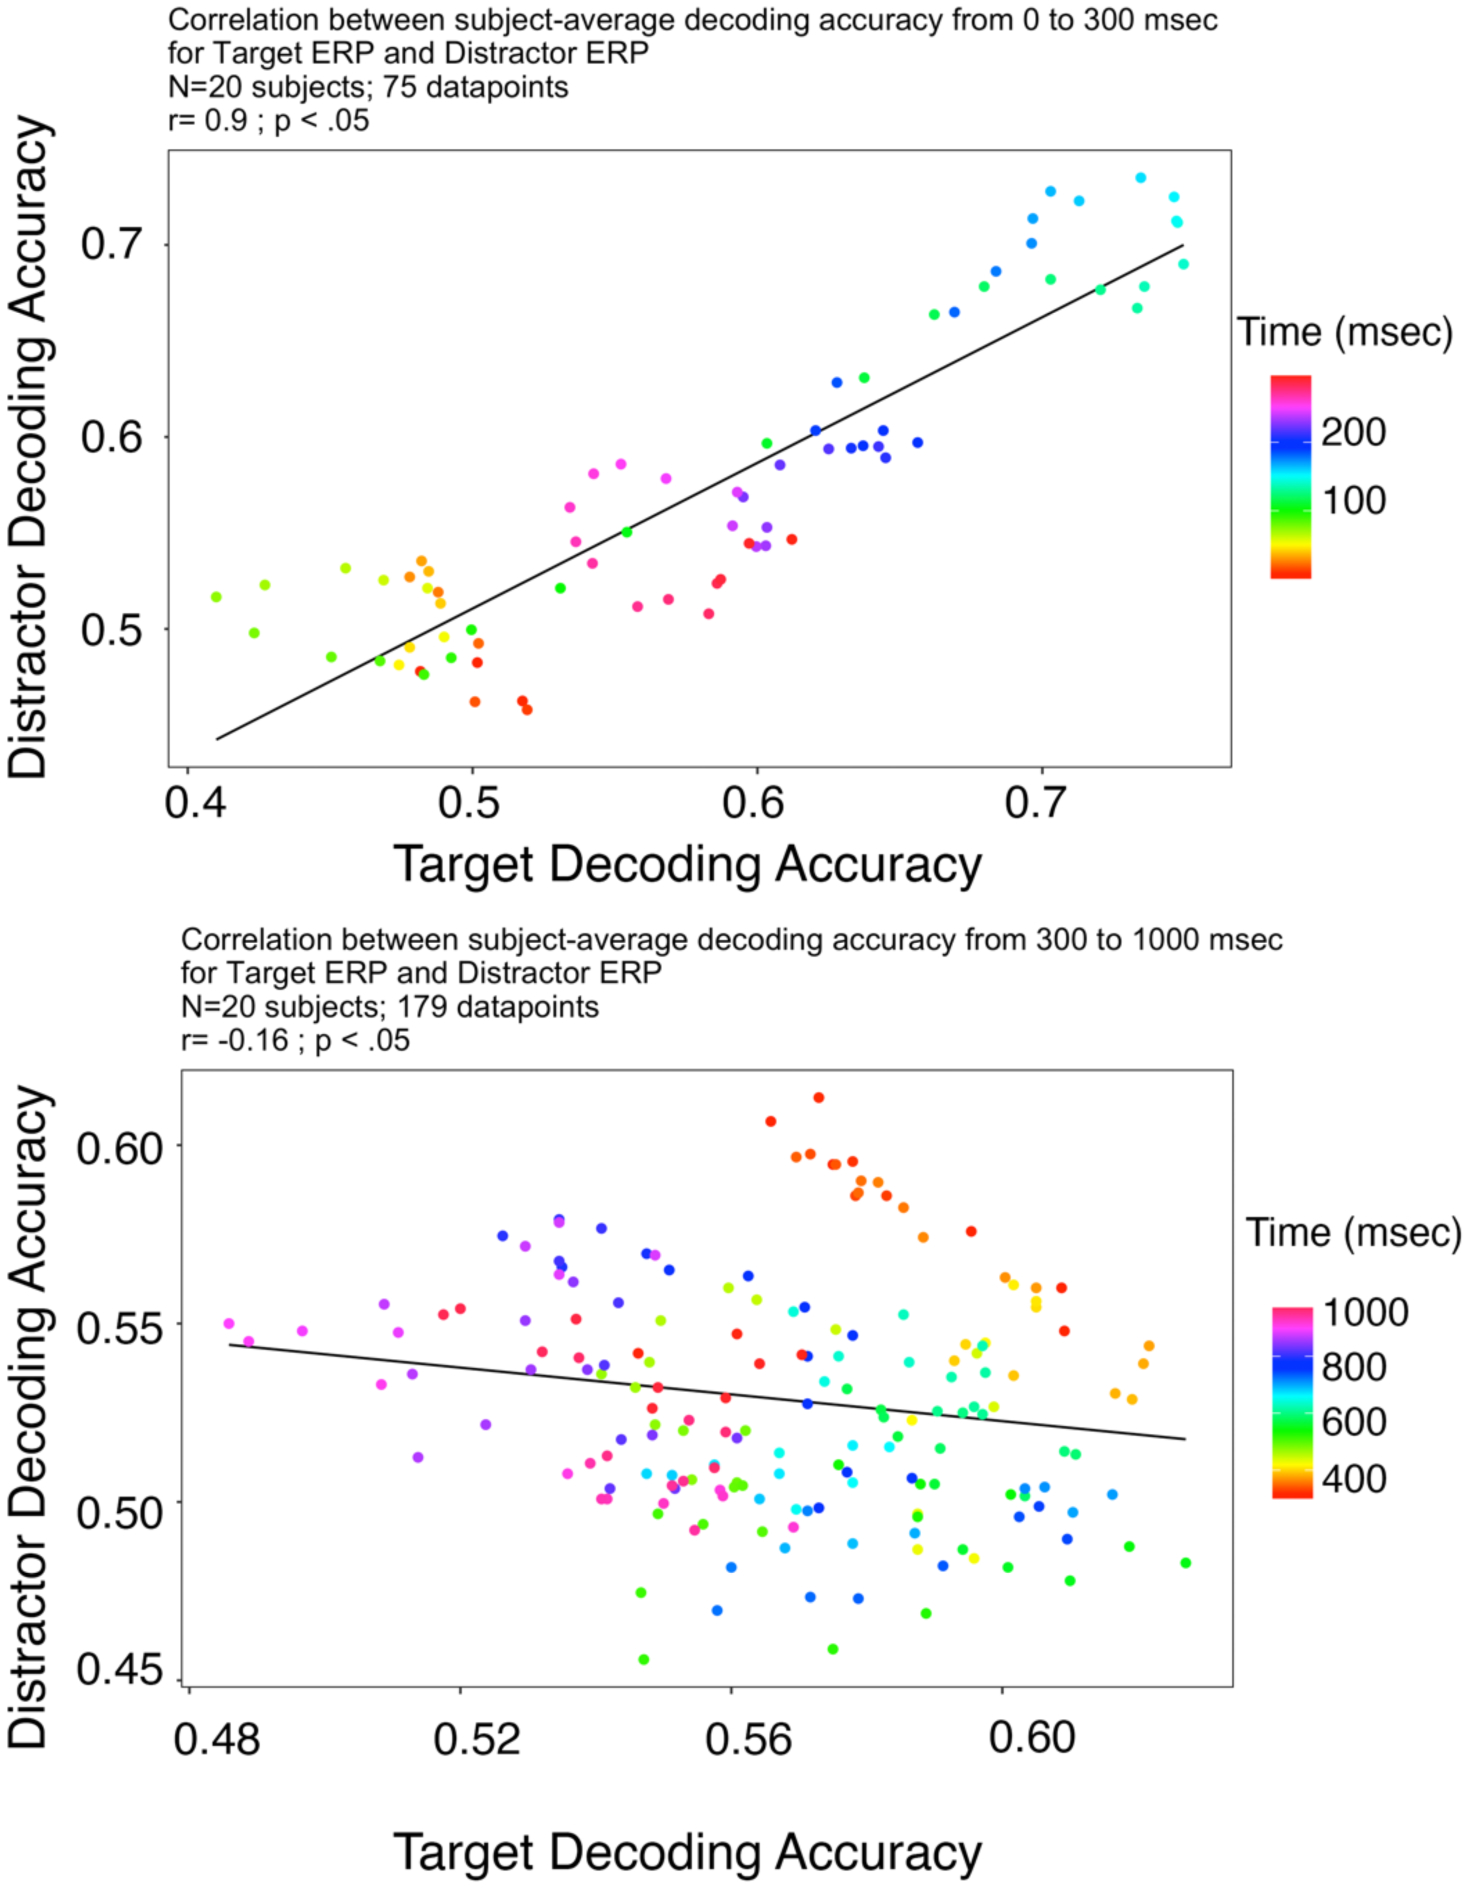
Figure 6. Correlation of subject-average decoding accuracy.

A. Correlations of subject-average decoding accuracy for Target and Distractor across stimulus period time points from 0 to 300 msec post-stimulus. B. Correlation of subject-average decoding accuracy for Target and Distractor across stimulus period time points from 300 – 1000 msec post-stimulus. The latency of the correlation of decoding is shown in the different colors, as indicated in the key; note that for each plot the color-coding of latency (time) is autoscaled to the specified time ranges. For both panels A and B, each data point in the correlation plot represents target and distractor decoding accuracy, averaged across subjects, at a time point in the stimulus epoch specified by the color of the point.
