
Figure 1.
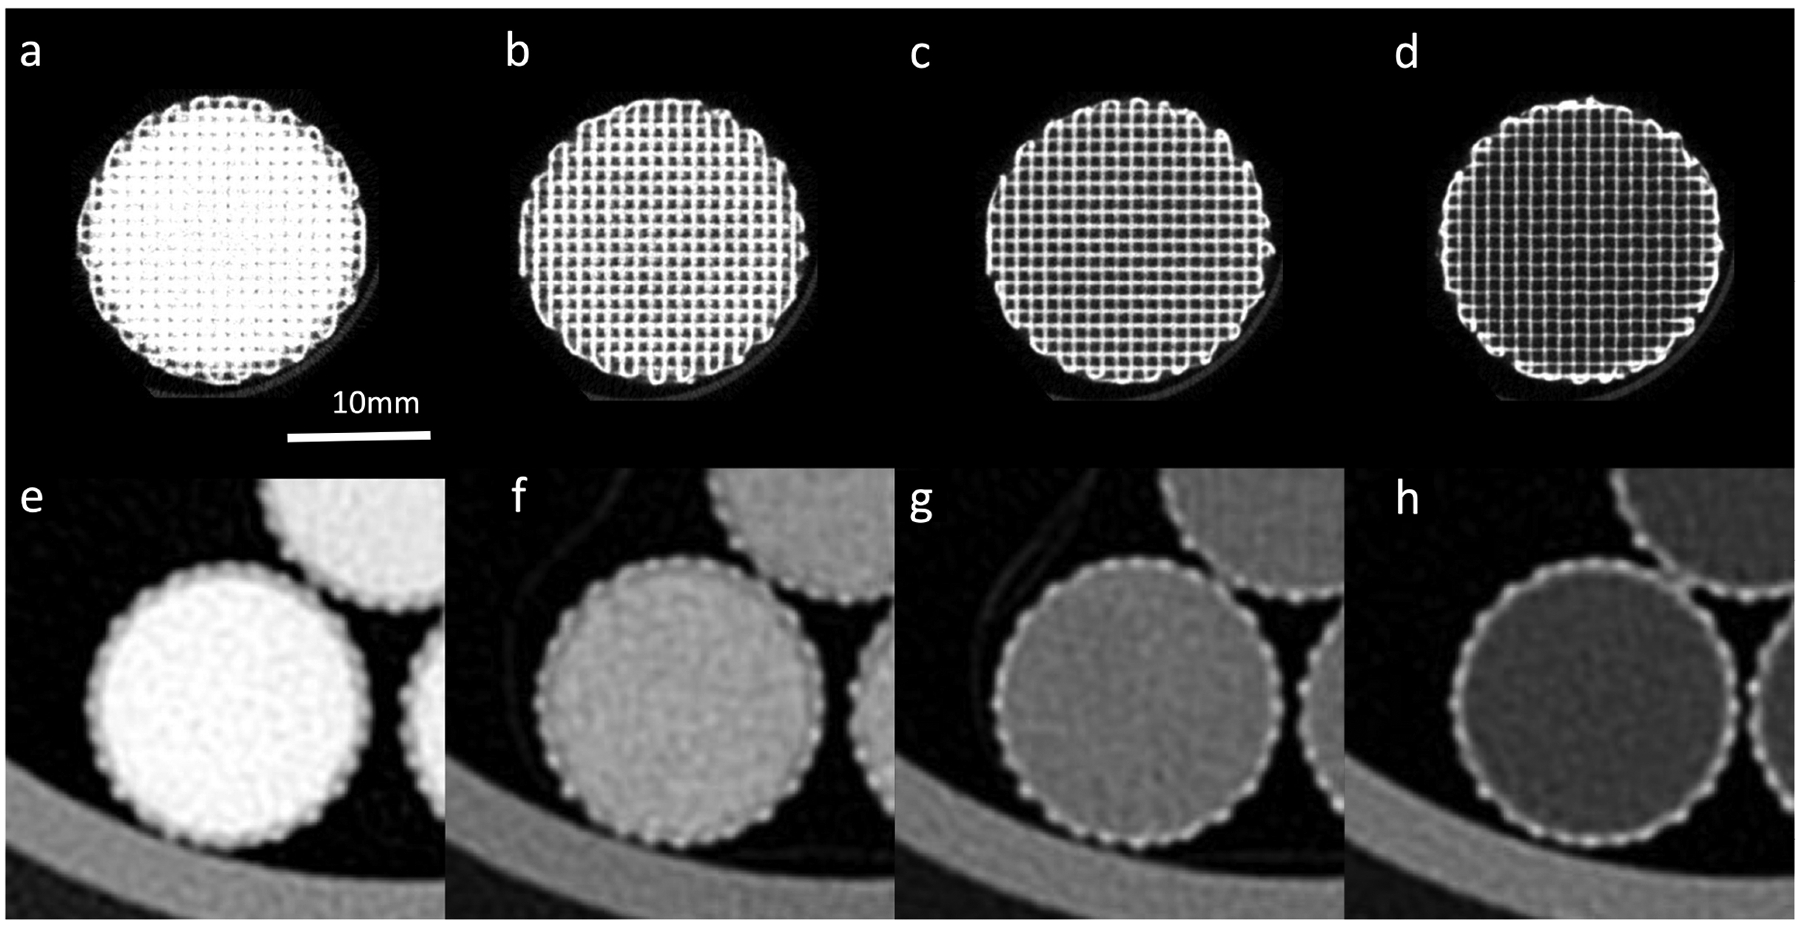
Micro-CT (first row, window min/max = −1000/2500 HU) and clinical CT images (second row, window min/max = −1000/1000 HU) of the four sections of a micro-CT phantom, with infill ratios of 1.0, 0.7, 0.5 and 0.3 (from left to right).
Official websites use .gov
A
.gov website belongs to an official
government organization in the United States.
Secure .gov websites use HTTPS
A lock (
) or https:// means you've safely
connected to the .gov website. Share sensitive
information only on official, secure websites.
Micro-CT (first row, window min/max = −1000/2500 HU) and clinical CT images (second row, window min/max = −1000/1000 HU) of the four sections of a micro-CT phantom, with infill ratios of 1.0, 0.7, 0.5 and 0.3 (from left to right).