
Figure 2. Changes in cell-type and cell-state composition of the mouse frontal cortex and striatum across ages.
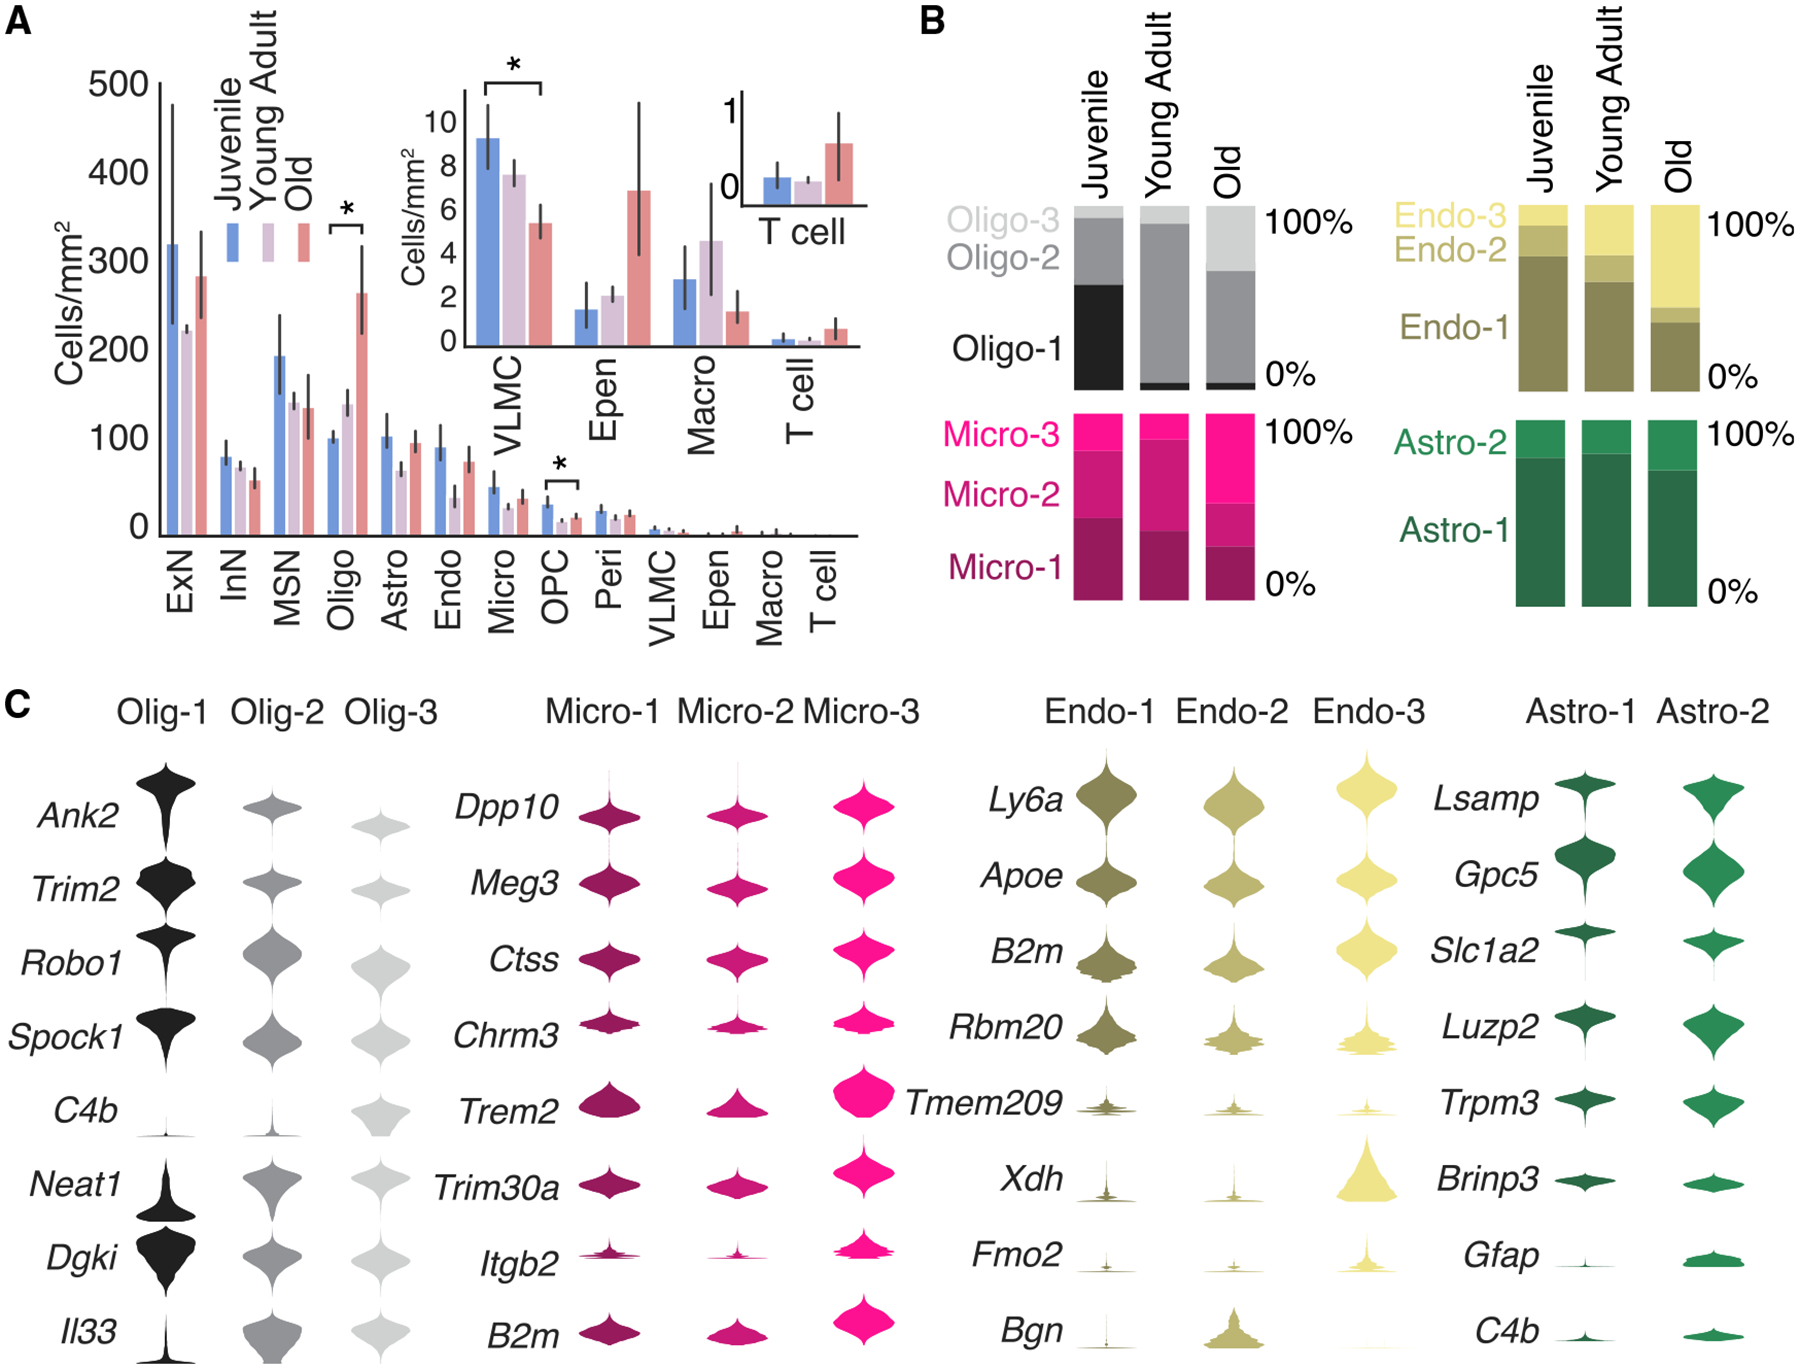
(A) Density of different major cell types (in cells/mm2) across the three ages. Inset shows magnified view of lower abundance cell types. * indicates FDR-adjusted p-value < 0.05 (independent sample t-test) in the difference between juvenile and old animals. Data are presented as mean ±95% confidence interval.
(B) Fraction of cells that belong to different states of oligodendrocytes, microglia, endothelial cells, and astrocytes across different ages.
(C) Violin plot of expression of example genes across different states of oligodendrocytes, microglia, endothelial cells, and astrocytes.