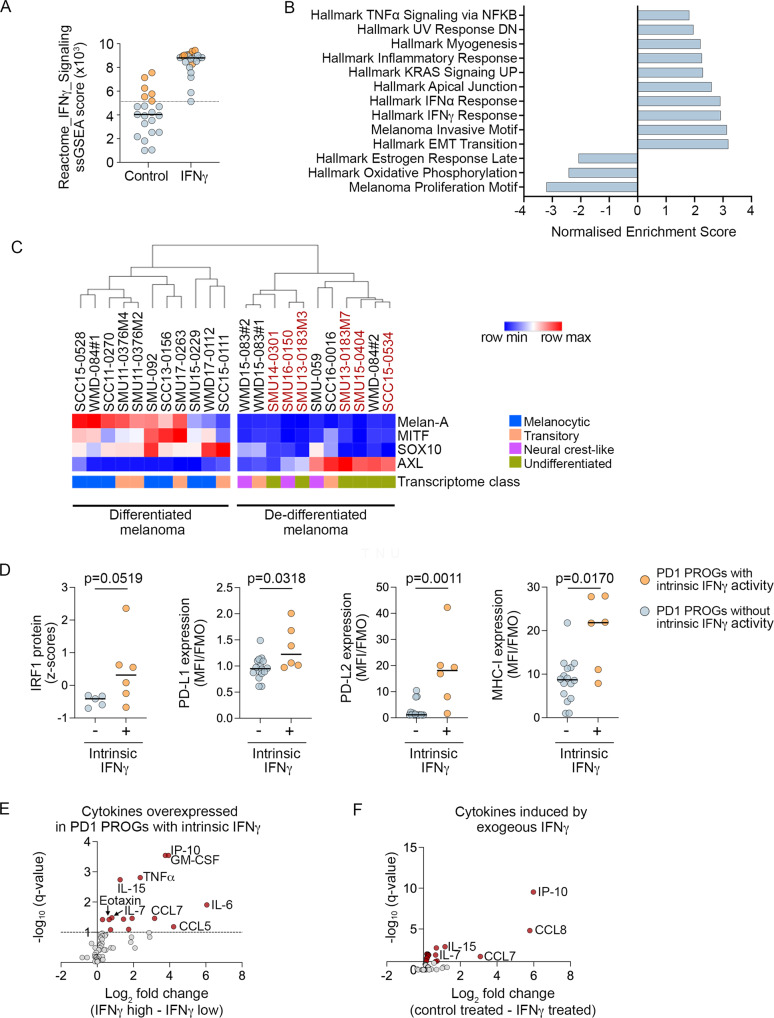
Fig. 2. Intrinsic IFNγ signaling in seven PD1 PROG cell lines.
A ssGSEA score for Reactome_IFNγ_Signaling in BSA control and IFNγ-treated PD1 PROG cell lines with (n = 6; orange) and without (n = 15; blue, not including SCC16-0016) intrinsic IFNγ activity. The dotted line aligns with the lowest ssGSEA score in the IFNγ-treated PD1 PROGs, and solid lines indicate the median ssGSEA scores. B Subset of top-scoring gene sets (GSEA Pre-Ranked; Hallmark gene set collection and melanoma-specific transcriptome signatures) in PD1 PROGs with (n = 6) compared to without (n = 15) intrinsic IFNγ activity (Supplementary Data S1). C Hierarchical clustering of PD1 PROG cell lines (n = 22) with Euclidean distance based on protein expression of Melan-A, MITF, SOX10, and AXL. The transcriptome melanoma clusters defined according to ref. 34 are also shown. PD1 PROG cell lines with intrinsic IFNγ signaling (n = 6) are highlighted in red. D Plots showing IRF1 protein expression (derived from the densitometric normalized protein data after log2 transformation and z score calculation) in PD1 PROGs with (n = 6) and without (n = 5) intrinsic IFNγ activity. The relative cell surface expression (median fluorescence intensity stained divided by fluorescence minus one control, MFI/FMO) of PD-L1, PD-L2, and MHC-I in PD1 PROGs with (n = 6) and without (n = 16) intrinsic IFNγ activity. Data compared using two-sided Mann–Whitney test, p-values shown. E Differentially expressed secreted cytokines (FDR-adjusted p-value < 0.1, dotted line) in control (BSA)-treated PD1 PROGs with (IFNγ-high; n = 6) or without (IFNγ-low; n = 15) intrinsic IFNγ signaling are highlighted in red. The comparison of secreted cytokine expression was performed using log2 transformed fluorescence intensity values (Supplementary Data S3). F Differentially expressed secreted cytokines (FDR-adjusted p-value < 0.1) in control (BSA)-treated PD1 PROGs versus IFNγ-treated PD1 PROG cell lines (n = 21; 1000 U IFNγ/ml for 24) are highlighted in red. The comparison of cytokine expression was performed using log2 transformed fluorescence intensity values (Supplementary Data S4). Source data are provided as a Source Data file.

