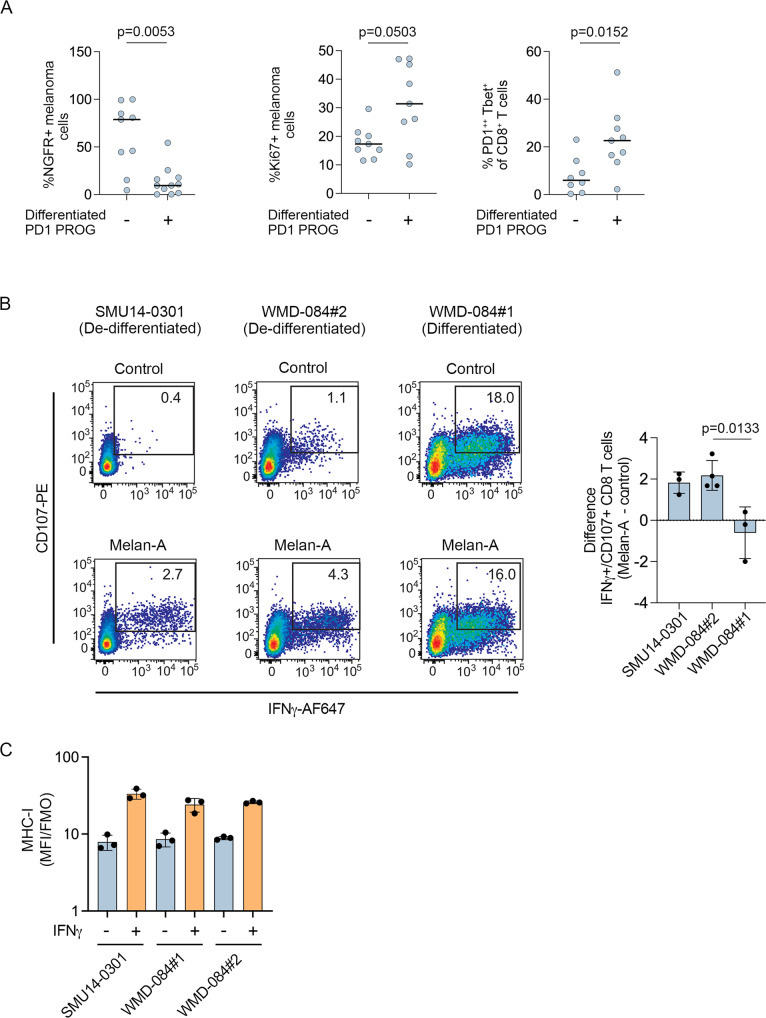
Fig. 4. Melanoma de-differentiation in immune checkpoint resistant melanoma.
A Plots showing the percentage of NGFR+ melanoma cells (n = 20), proliferating Ki67+ melanoma cells (n = 18) in the melanoma (CD45-SOX10+) subset, and PD1++Tbet+ CD8+ T (n = 17) cells in the CD8+ T cell subset in tumor dissociates from matched PD1 PROG cell lines. The samples are organized according to the differentiation phenotype of the matched PD1 PROG cell line. Horizontal bars indicate the median. Data compared using two-sided Mann–Whitney test, p-values shown. B Representative scatterplots showing reactivity of CD8+ T cells (CD107+/IFNγ+) to the indicated PD1 PROG cell lines after pulsing with DMSO control or 10 µg/ml Melan-A peptide (AAGIGILTV) 2 h before co-culture with HLA-A02:01+ CD8+ T cells derived from the WMD-084 tumor dissociate. Bar graph shows the mean ± sd difference (Melan-A peptide pulsed minus control pulsed) in percentage of CD107+/IFNγ+ CD8+ T cells (n = 3 for SMU14-0301 and WMD-084#1 and n = 4 for WMD-084#2 biologically independent experiments). The change in CD8+ T cell reactivity in the patient-matched WMD-084 #1 and #2 PD1 PROG cells was compared using an unpaired, two-tailed t-test, exact p-values shown. C Cell surface expression (median fluorescence intensity stained divided by fluorescence minus one control, MFI/FMO) of MHC-I in the indicated cell lines at 72 h after treatment with BSA control or IFNγ (1000 U/ml). Mean ± sd average of three biological replicates shown for each cell line. Source data are provided as a Source Data file.

