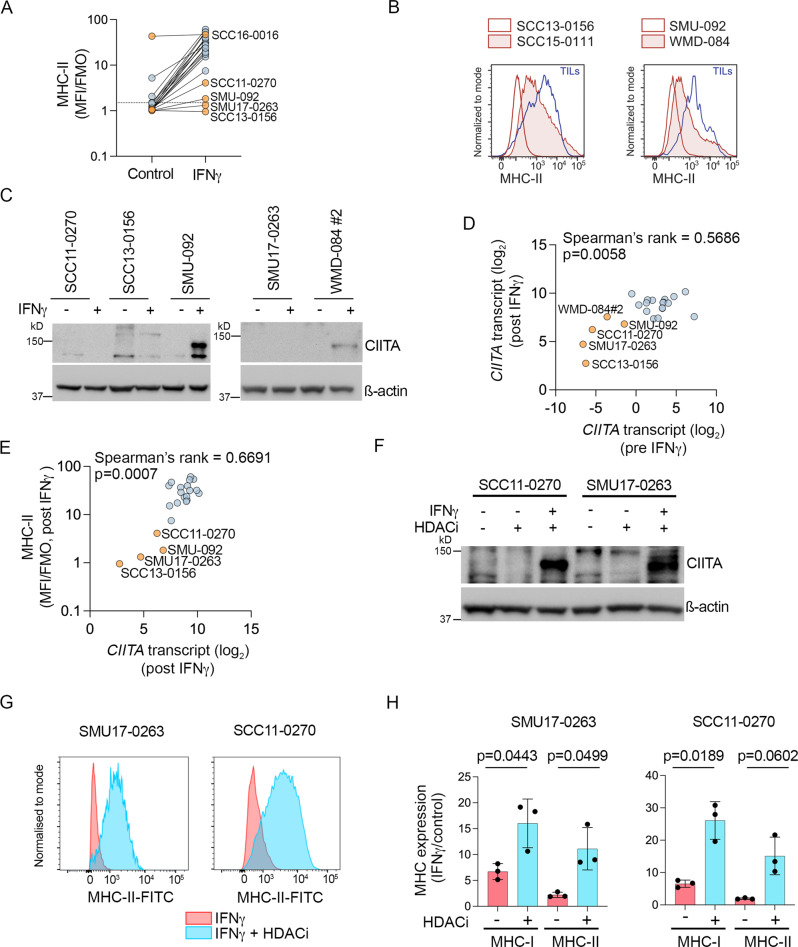
Fig. 6. MHC-II expression is silenced in PD1 PROG cell lines.
A Expression (median fluorescence intensity of at least three biological replicates for each cell line divided by fluorescence minus one control, MFI/FMO) of MHC-II on PD1 PROGs (n = 22), 72 h after treatment with BSA control or IFNγ (1000 U/ml). SCC16-0016 and PD1 PROGs with low MHC-II expression are highlighted in orange. B Representative histograms showing melanoma MHC-II expression in tumor dissociates of B2M-mutant SCC13-0156 and SMU-092 (unshaded red histograms) compared to autologous TILs (blue). MHC-II expression on B2M-wild-type SCC15-0111 and WMD-084 shown for comparison (shaded red histograms). C Accumulation of CIITA protein in 5 PD1 PROGs, 24 h after treatment with BSA control (−) or IFNγ (1000 U/ml). Experiment repeated independently at least three times. D Scatterplot showing correlation of CIITA transcript expression pre and post IFNγ treatment in 22 PD1 PROG cell lines. PD1 PROGs with low CIITA expression (n = 5) are highlighted in orange. Correlation calculated using two-sided Spearman’s rank correlation coefficient, exact p-values shown. E Scatterplot showing correlation of MHC-II expression (MFI/FMO, MFI post IFNγ treatment) with expression of CIITA transcript (post IFNγ treatment) in PD1 PROGs (n = 22). PD1 PROGs with low MHC-II expression are highlighted in orange. Correlation calculated using two-sided Spearman’s rank correlation coefficient, exact p-values shown. F Accumulation of CIITA protein in the SCC11-0270 and SMU17-0263 PD1 PROGs, 72 h after treatment with BSA control, panobinostat (HDACi, 25 nM) in the presence or absence of IFNγ (1000 U/ml). Experiment repeated independently at least three times. G Representative histograms showing melanoma MHC-II expression in MHC-IIlow SCC17-0263 and SCC11-0270 PD1 PROGs treated with 1000 U/ml IFNγ (shaded red histograms) or IFNγ with panobinostat (HDACi; shaded blue histograms). H Bar graphs show relative MHC-I and MHC-II expression (IFNγ/control-treated) in SCC17-0263 and SCC11-0270 PD1 PROGs treated with 1000 U/ml IFNγ or IFNγ with panobinostat (HDACi). Individual values and mean ± sd of three biological replicates are shown and paired, two-tailed t-test was used to compare the data, exact p-values shown. Source data are provided as a Source Data file.

