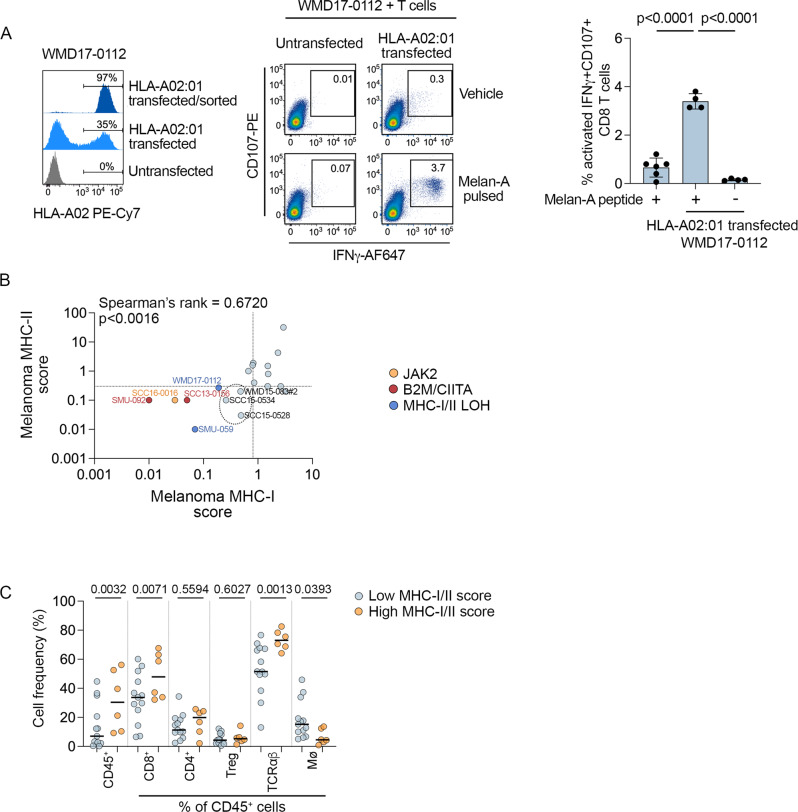
Fig. 7. Loss of MHC antigen presentation molecules.
A Representative histograms showing expression of HLA-A02:01 in the WMD17-0012 PD1 PROG melanoma cells (HLA-A02:01 LOH, Melan-Anull). Untransfected cells are compared to cells transfected with HLA-A02:01 pre and post flow sorting (left panel). Reactivity of allogenic HLA-A02:01 matched CD8+ T cells (CD107+/IFNγ+) to untransfected or HLA-A02:01-transfected WMD17-0112 cells pulsed with 10 µg/ml Melan-A peptide (AAGIGILTV) or vehicle control, 1.5 h before co-culture (middle panel). Bar graph shows percentage (individual values and mean ± sd) of reactive CD107+ IFNγ+ CD8+ T cells co-cultured with untransfected/Melan-A pulsed (+) WMD-0112 cells (n = 6 biological replicates) and HLA-A02:01-transfected Melan-A pulsed (+) or HLA-A02:01 vehicle treated (−) WMD17-0112 cells (n = 4 biological experiments). Data compared using one-way ANOVA with Tukey’s multiple comparison test, adjusted p-values are shown. B Scatterplot showing correlation of MHC-II and MHC-I expression (expression score relative to TILs) in PD1 PROG tumor dissociates (n = 19). Correlation calculated using two-sided Spearman’s rank correlation coefficient, p-value is shown. Tumor samples with established alterations in JAK2 (SCC16-0016), MHC-I/II (WMD17-0112, SMU-059), B2M/CIITA (SMU-092, SCC13-0156) are highlighted and color-coded. Three tumors with low MHC-I/-II expression on melanoma without causal mechanisms are circled. Dotted lines indicate median MHC-I and MHC-II scores. C Percentage of CD45+ cells and frequency of CD8+, CD4+ and regulatory T cells (Treg), macrophages (Mø), and TCRαβ cells (as a percentage of CD45+ cells) in PD1 PROG tumor dissociates with high MHC-I and/or MHC-II score (above median; n = 6) vs low MHC-I and/or MHC-II score (below median; n = 13). Data compared using one-way ANOVA corrected for multiple comparisons by controlling the False Discovery Rate (q < 0.1); adjusted p-values are shown.

