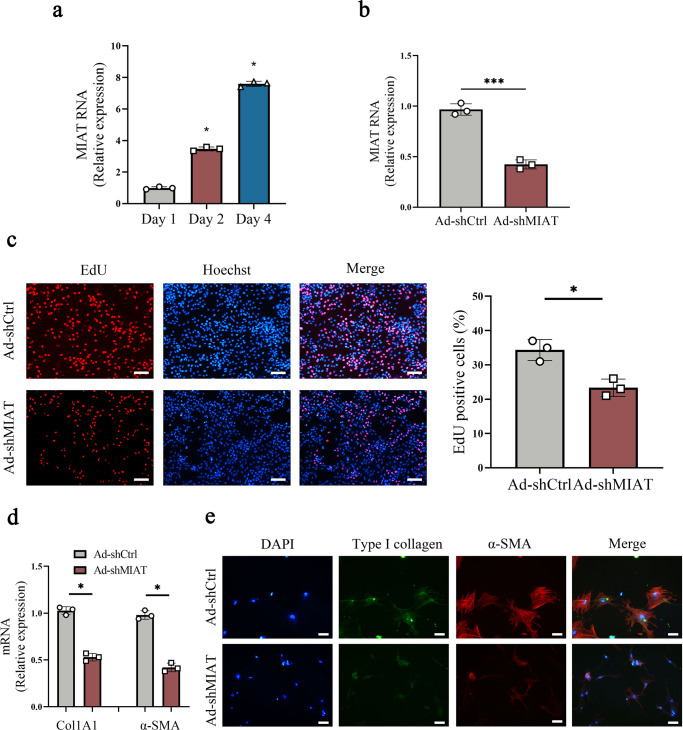
Fig. 2. Loss of MIAT promotes the suppression of HSC proliferation and activation.
a MIAT expression in primary HSCs at day 1, 2 and 4 (n = 3 per group). b MIAT expression in primary HSCs transduced with Ad-shMIAT (n = 3 per group). c EdU assay in HSCs with Ad-shMIAT treatment (n = 3 per group). Scale bar, 50 μm. d Col1A1 and α-SMA expressions (n = 3 per group). e Immunofluorescence staining for Type I collagen (green) and α-SMA (red) in HSCs with Ad-shMIAT treatment. Scale bar, 20 μm. Each value is the mean ± SD of three independent experiments. *p < 0.05, ***p < 0.001 compared with the control.

