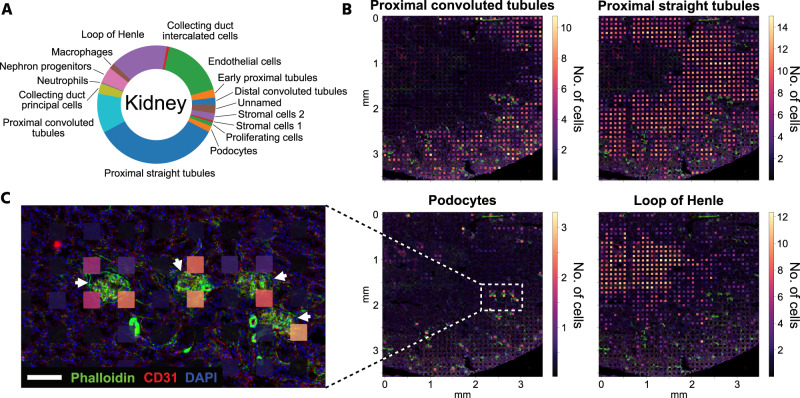
Fig. 5. Deconvolution of xDBiT kidney dataset to spatially resolve cell types.
A Data of one representative kidney section was deconvolved using cell2location13 and a single-cell RNA-seq dataset of the murine kidney41. Pie chart shows the cell type composition of the deconvolved kidney section. B High-resolution fluorescence images overlaid with xDBiT spots colored for the deconvolution results of four representative kidney cell types. Spot colors correspond to the minimum number of cells predicted. C Detailed fluorescence image. Arrows denote the position of glomeruli. Overlaid xDBiT spots show the number of podocytes predicted by cell2location. DAPI (blue), phalloidin (green), and CD31 (red). Scale bar: 100 µm.

