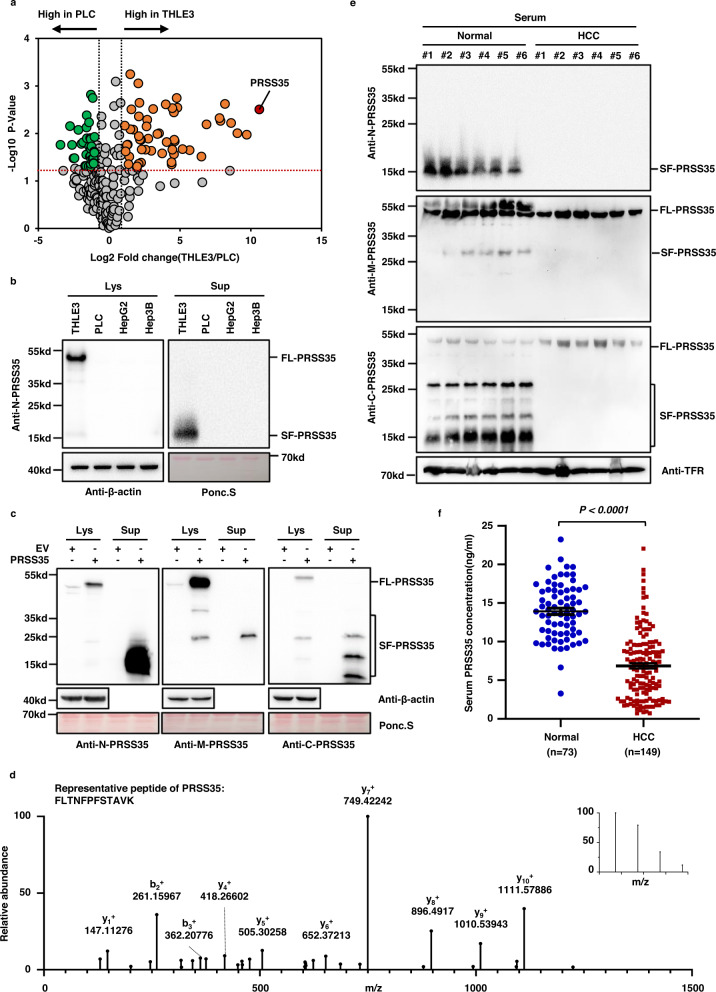
Fig. 1. PRSS35 is a secreted protein that decreased in HCC patients.
a Proteomic analysis and comparison of THLE3 and PLC secretome (without non-classical secreted proteins) presented as a volcano plot. The red transverse dashed line indicates adjusted P-value of 0.05. The left black longitudinal dashed line indicates a fold-change (FC) of 0.5 and the right black longitudinal dashed line indicates a FC of 2.0. Orange dots: significantly increased proteins in THLE3 secretome (P < 0.05, FC > 2.0). Green dots: significantly decreased proteins in THLE3 (P < 0.05, FC < 0.5). The experiment was repeated three times. b Western blot analysis of intracellular and extracellular PRSS35 protein levels using anti-N-PRSS35 antibody in THLE3, PLC, HepG2 and Hep3B cells. Ponceau staining and β-actin served as loading control. FL full length, SF short form, Lys lysate (intracellular proteins), Sup supernatant (extracellular proteins). c Western blot analysis of intracellular and extracellular PRSS35 protein levels using three different antibodies in PLC cells stably expressing PRSS35 or control empty vector (EV). Ponceau staining and β-actin served as loading control. FL full length, SF short form. d Collection of extracellular proteins from PLC cells stably expressing PRSS35, followed by SDS-PAGE analysis and mass spectrometry analysis of extracellular PRSS35 protein in SDS-PAGE gel where SF-PRSS35 located in. Representative PRSS35 peptide from MS/MS spectra was shown. The inset of the MS/MS spectrum was the precursor’s MS spectrum. e PRSS35 protein levels were determined with three different antibodies by western blot using the serum samples from normal subjects (Normal) and human HCC patients (HCC), respectively. Transferrin (TFR) served as loading control. f Serum PRSS35 concentration was measured by customized ELISA kit from 73 normal subjects and 149 human HCC patients. Data are presented as the mean ± s.e.m. (f). Statistical significance was determined by two-tailed unpaired Student’s t-test (f). The blotting experiments were repeated at least three times with biological replicates (b, c, e). Source data are provided as a Source Data file.

