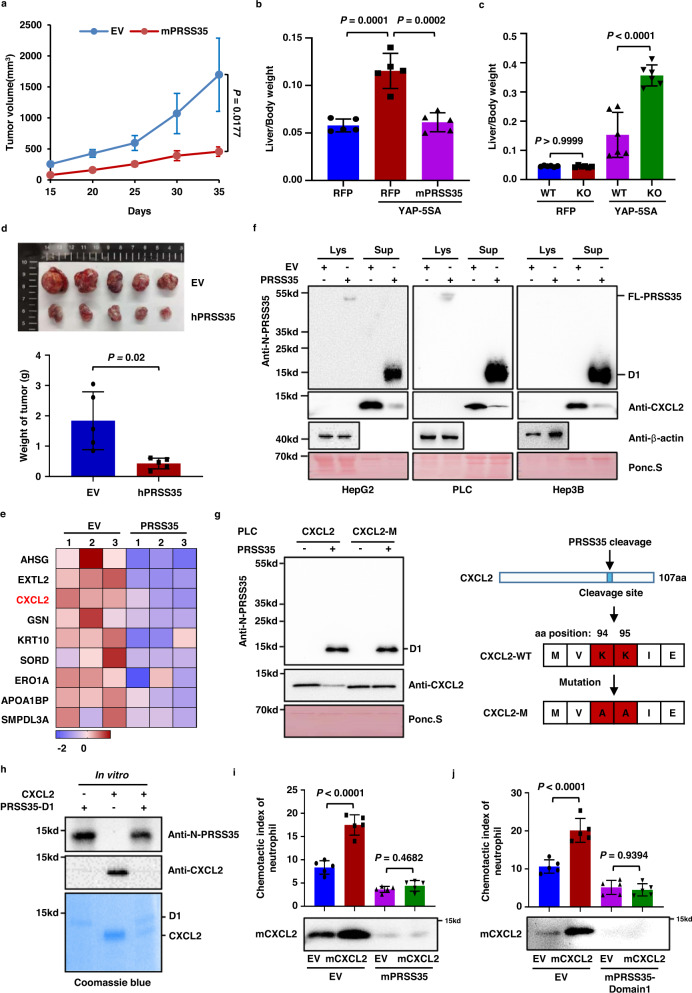
Fig. 3. PRSS35 suppresses neutrophil migration by degrading CXCL2.
a Hepa1-6 cells stably expressing Flag-mPRSS35 or EV were injected subcutaneously into C57BL/6J mice. Tumor growth was measured starting from 15 days after inoculation (n = 6 biological replicates). b Plasmids expressing YAP-5SA alone or YAP-5SA plus Flag-mPRSS35 together with PB transposase plasmids were delivered into ICR (Institute of Cancer Research) mice by hydrodynamic injection. YAP-5SA induced liver tumorigenesis was analyzed approximately 100 days after injection. Red fluorescent protein (RFP) served as a control. Liver/body weight ratios were measured at the end of the experiment (n = 5 biological replicates). c Plasmids expressing YAP-5SA or RFP together with PB transposase plasmids were delivered into mPRSS35-KO or WT C57BL/6J mice by hydrodynamic injection. YAP-5SA induced liver tumorigenesis was analyzed approximately 100 days after injection. Liver/body weight ratios were measured at the end of the experiment (n = 6 biological replicates). d Equal numbers of HepG2 cells overexpressing EV or hPRSS35 were injected subcutaneously into Balb/c-nude mice. Photograph and weight of tumors at the end of the experiment (35 days after injection, n = 5 biological replicates). e Heat map analysis of SILAC secretomics data. The proteins significantly decreased in PLC cells stably expressing PRSS35 compared to EV were shown. Red indicates relative high level, whereas blue indicates relative low level. f Western blot analysis of intracellular and extracellular CXCL2 protein levels in HepG2, PLC and Hep3B cells stably expressing PRSS35 or EV. Ponceau staining and β-actin served as loading control. g Western blot analysis of the cleavage of CXCL2 by PRSS35 after mutation of K94 and K95 into A94 and A95 in PLC cells (left panel). Diagram shows mutation site of CXCL2 (right panel). h PRSS35-D1 protein purified from E. coli was incubated with CXCL2 protein at 37°C for 48 h. D1: PRSS35 domain1. i Neutrophils migration rates were determined in the conditional medium from Hepa1-6 stably expressing EV, mCXCL2, Flag-mPRSS35, or mCXCL2 plus Flag-mPRSS35 (upper panel, n = 5 biological replicates). Western blot analysis of mCXCL2 protein levels in Hepa1-6 cells stably expressing EV, mCXCL2, Flag-mPRSS35, or mCXCL2 plus Flag-mPRSS35 (lower panel). j Neutrophils migration rates were determined in the conditional medium from Hepa1-6 stably expressing EV, mCXCL2 or their medium treated with purified mPRSS35-domain1 (upper panel, n = 5 biological replicates). Western blot analysis of mCXCL2 protein levels in above conditional medium (lower panel). Data are presented as the mean ± s.d. (a–d, i, j). Statistical significance was determined by two-way ANOVA (a–d, i, j). The blotting experiments were repeated at least three times with biological replicates (f, g–j). Source data are provided as a Source Data file.

