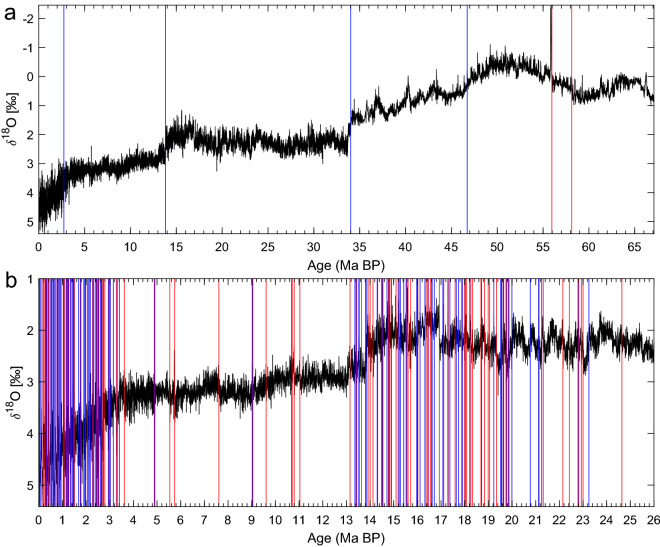
Figure 4.
CENOGRID stack of benthic O23. Vertical lines represent transitions detected by the KS test19, with colors indicating the direction of the jumps. Grey bars represent warm episodes. (a) Transitions detected for the entire record using a window w range of 1–4 Myr, and (b) transitions detected for the interval 26–0 Ma BP using a w range of 0.02–2.5 Myr; see also the earlier subsection on “Methodology.” The vertical axes are reversed.

