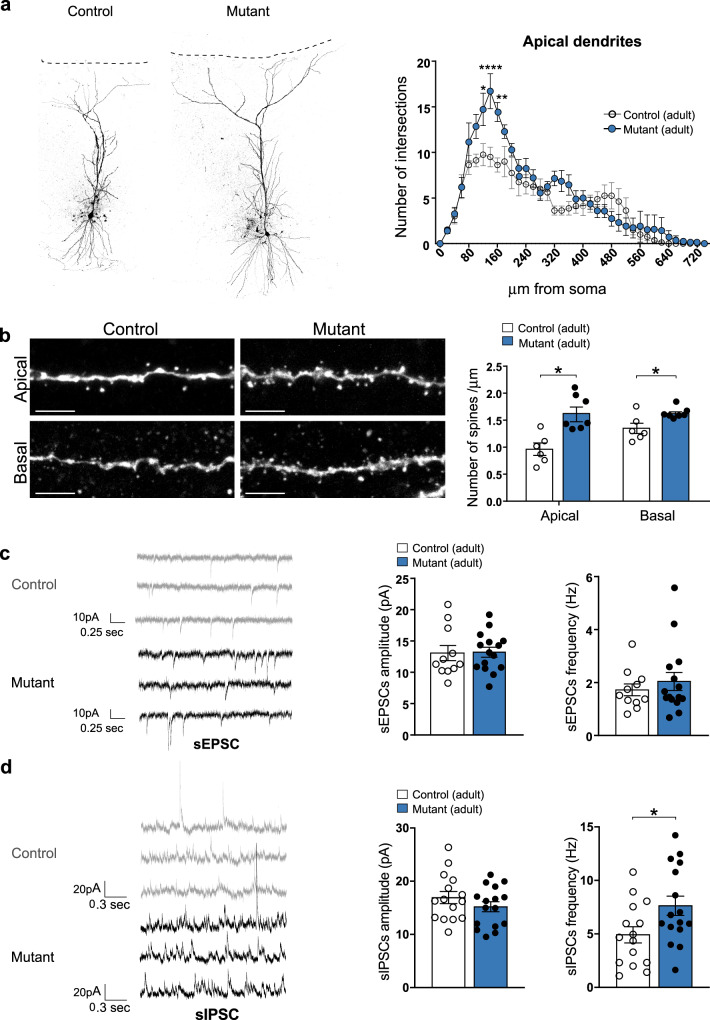
Fig. 5. CRs abnormal survival leads to increased spine density and sIPSC frequency in adult CA1 pyramidal neurons.
a Representative examples of CA1 pyramidal neurons filled with biocytin in adult control and BaxCKO mutants (left panel). Sholl analysis for the apical dendrites in controls and mutants showing an increase of cell complexity between 120 and 160 µm from the soma (p = 0.0133, <0.0001 and 0.0012, respectively, post hoc Sidak’s multiple comparison test, F(1, 13) = 5.862; p = 0.0308 for genotype, RM two-way ANOVA; n = 8 controls and n = 7 mutants; right panel). b Representative confocal images showing spines in apical (top) and basal (bottom) dendritic segments of CA1 pyramidal neurons in control littermates and BaxCKO adult mutants (left panels). Quantification of spine density (number of spines/μm right panels) in apical and basal dendrites showing an increase in mutant animals compared to controls (p = 0.0260 for apical and 0.0350 for basal; Mann–Whitney test, n = 6 controls and n = 6 mutants for apical and n = 6 controls and n = 7 mutants for basal). c Representative traces of sEPSCs recorded from CA1 pyramidal neurons in voltage-clamp mode at −60 mV in brain slices from adult control and mutant animals (left). No changes in mean sEPSC amplitude (p = 0.6461) or frequency (p = 0.6832) between mutant and control animals (n = 11 controls and n = 15 mutants, Mann–Whitney test). d Same as C but for sIPSCs recorded in voltage-clamp at 0 mV. sIPSC frequency was significantly increased (p = 0.0405) in brain slices from mutant animals while sIPSCs amplitude remained constant (p = 0.2995; Mann–Whitney test, n = 15 controls and 16 mutants). Scale bar: 5 μm. Asterisks indicate statistical significance (*p < 0.05; **p < 0.01; ****p < 0.0001). All data are presented as mean ± SEM.

